Open Access
Fig. 14.
Download original image
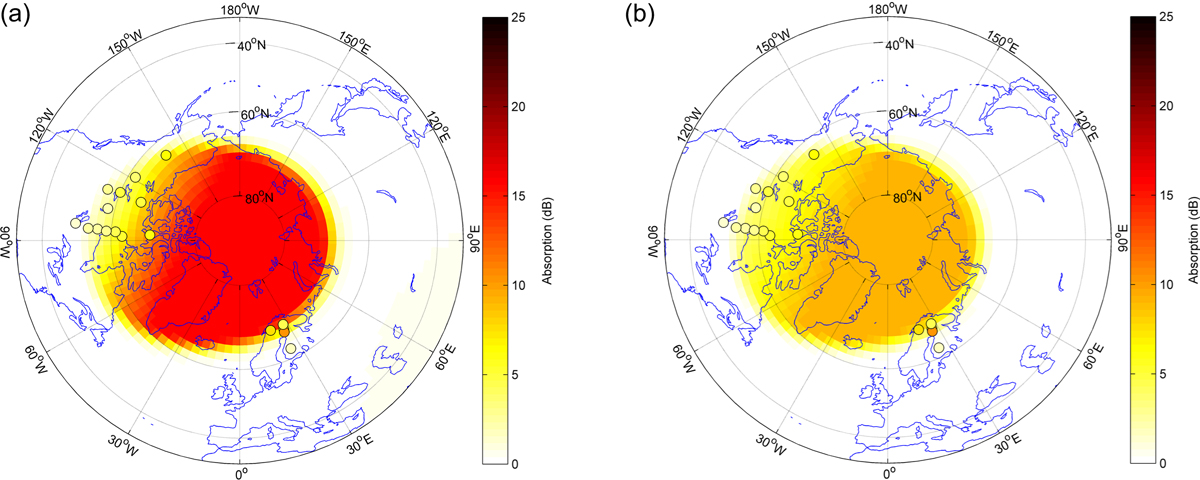
Disc colours indicate absorption measured on riometers from the NORSTAR and SGO arrays on 15/7/2000 08:00 UT. Background colour represents (a) DRAP predictions, (b) DRAP modified with parameters mn = 0.065, md = 0.022 found by regression to all riometers in the prior 30-min period.
Current usage metrics show cumulative count of Article Views (full-text article views including HTML views, PDF and ePub downloads, according to the available data) and Abstracts Views on Vision4Press platform.
Data correspond to usage on the plateform after 2015. The current usage metrics is available 48-96 hours after online publication and is updated daily on week days.
Initial download of the metrics may take a while.