Open Access
Fig. 15.
Download original image
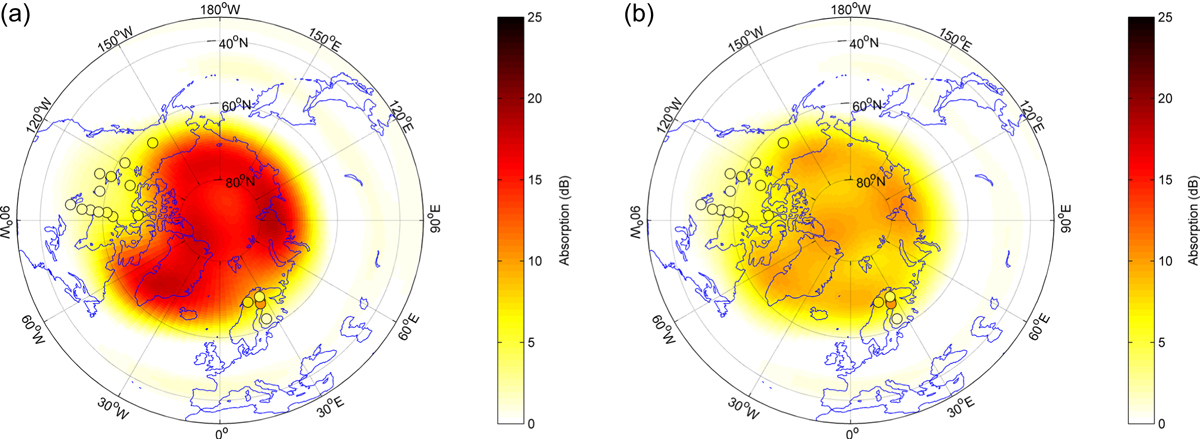
As for Figure 14 but with background colours representing (a) a 6th order sum of spherical harmonics fit by regression to the riometer data and DRAP data points; (b) as for (a) but using optimised DRAP parameters mn and md as in Figure 14b.
Current usage metrics show cumulative count of Article Views (full-text article views including HTML views, PDF and ePub downloads, according to the available data) and Abstracts Views on Vision4Press platform.
Data correspond to usage on the plateform after 2015. The current usage metrics is available 48-96 hours after online publication and is updated daily on week days.
Initial download of the metrics may take a while.