Open Access
Fig. 5.
Download original image
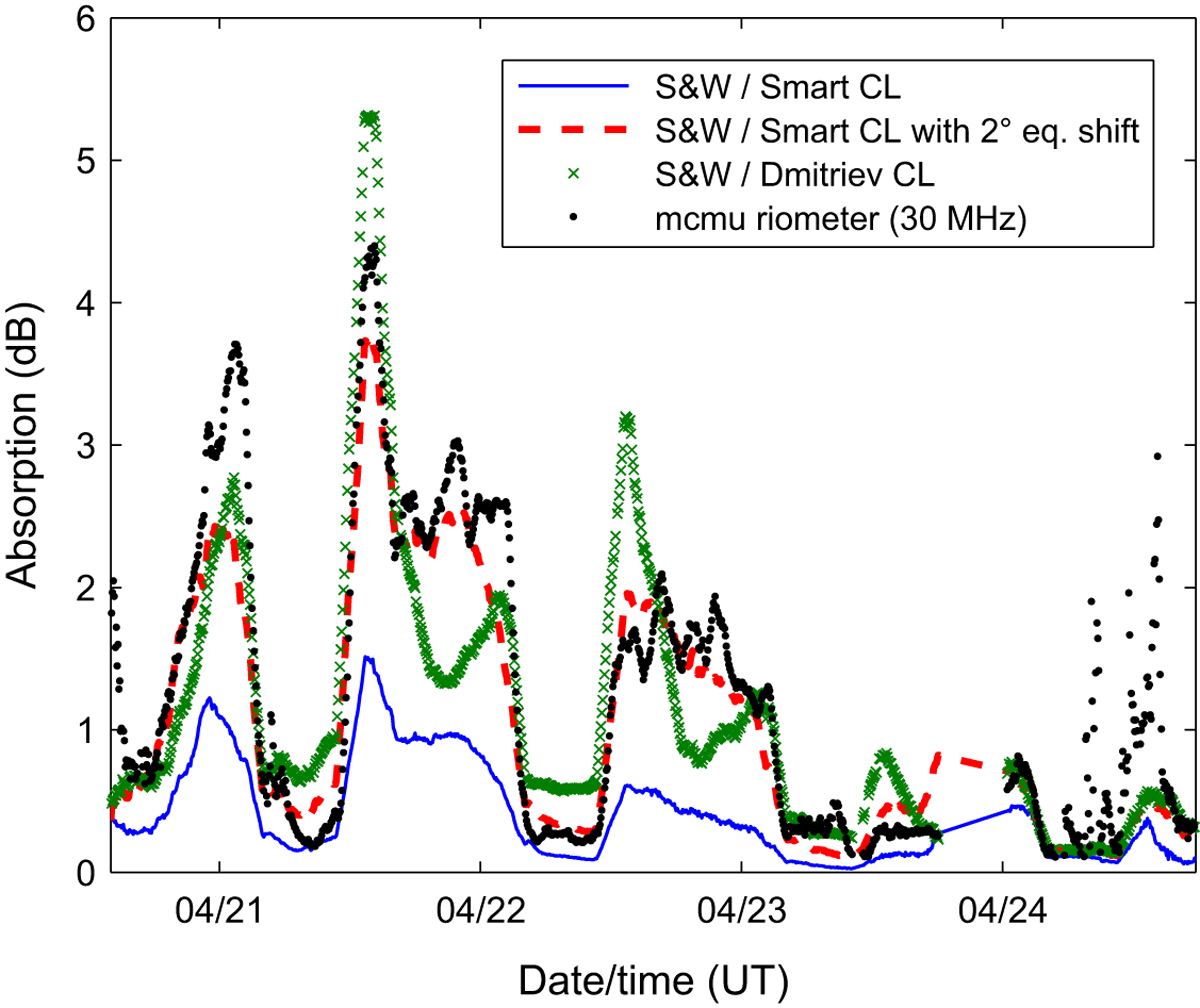
30 MHz absorption at Fort McMurray during the April 1998 SPE, plotted with superposed predictions of Sauer & Wilkinson (2008) (S&W), which uses the Smart et al. (1999) CL model, S&W with a 2° equatorward shift of the CL, and S&W with CL defined by Dmitriev et al. (2010).
Current usage metrics show cumulative count of Article Views (full-text article views including HTML views, PDF and ePub downloads, according to the available data) and Abstracts Views on Vision4Press platform.
Data correspond to usage on the plateform after 2015. The current usage metrics is available 48-96 hours after online publication and is updated daily on week days.
Initial download of the metrics may take a while.