Open Access
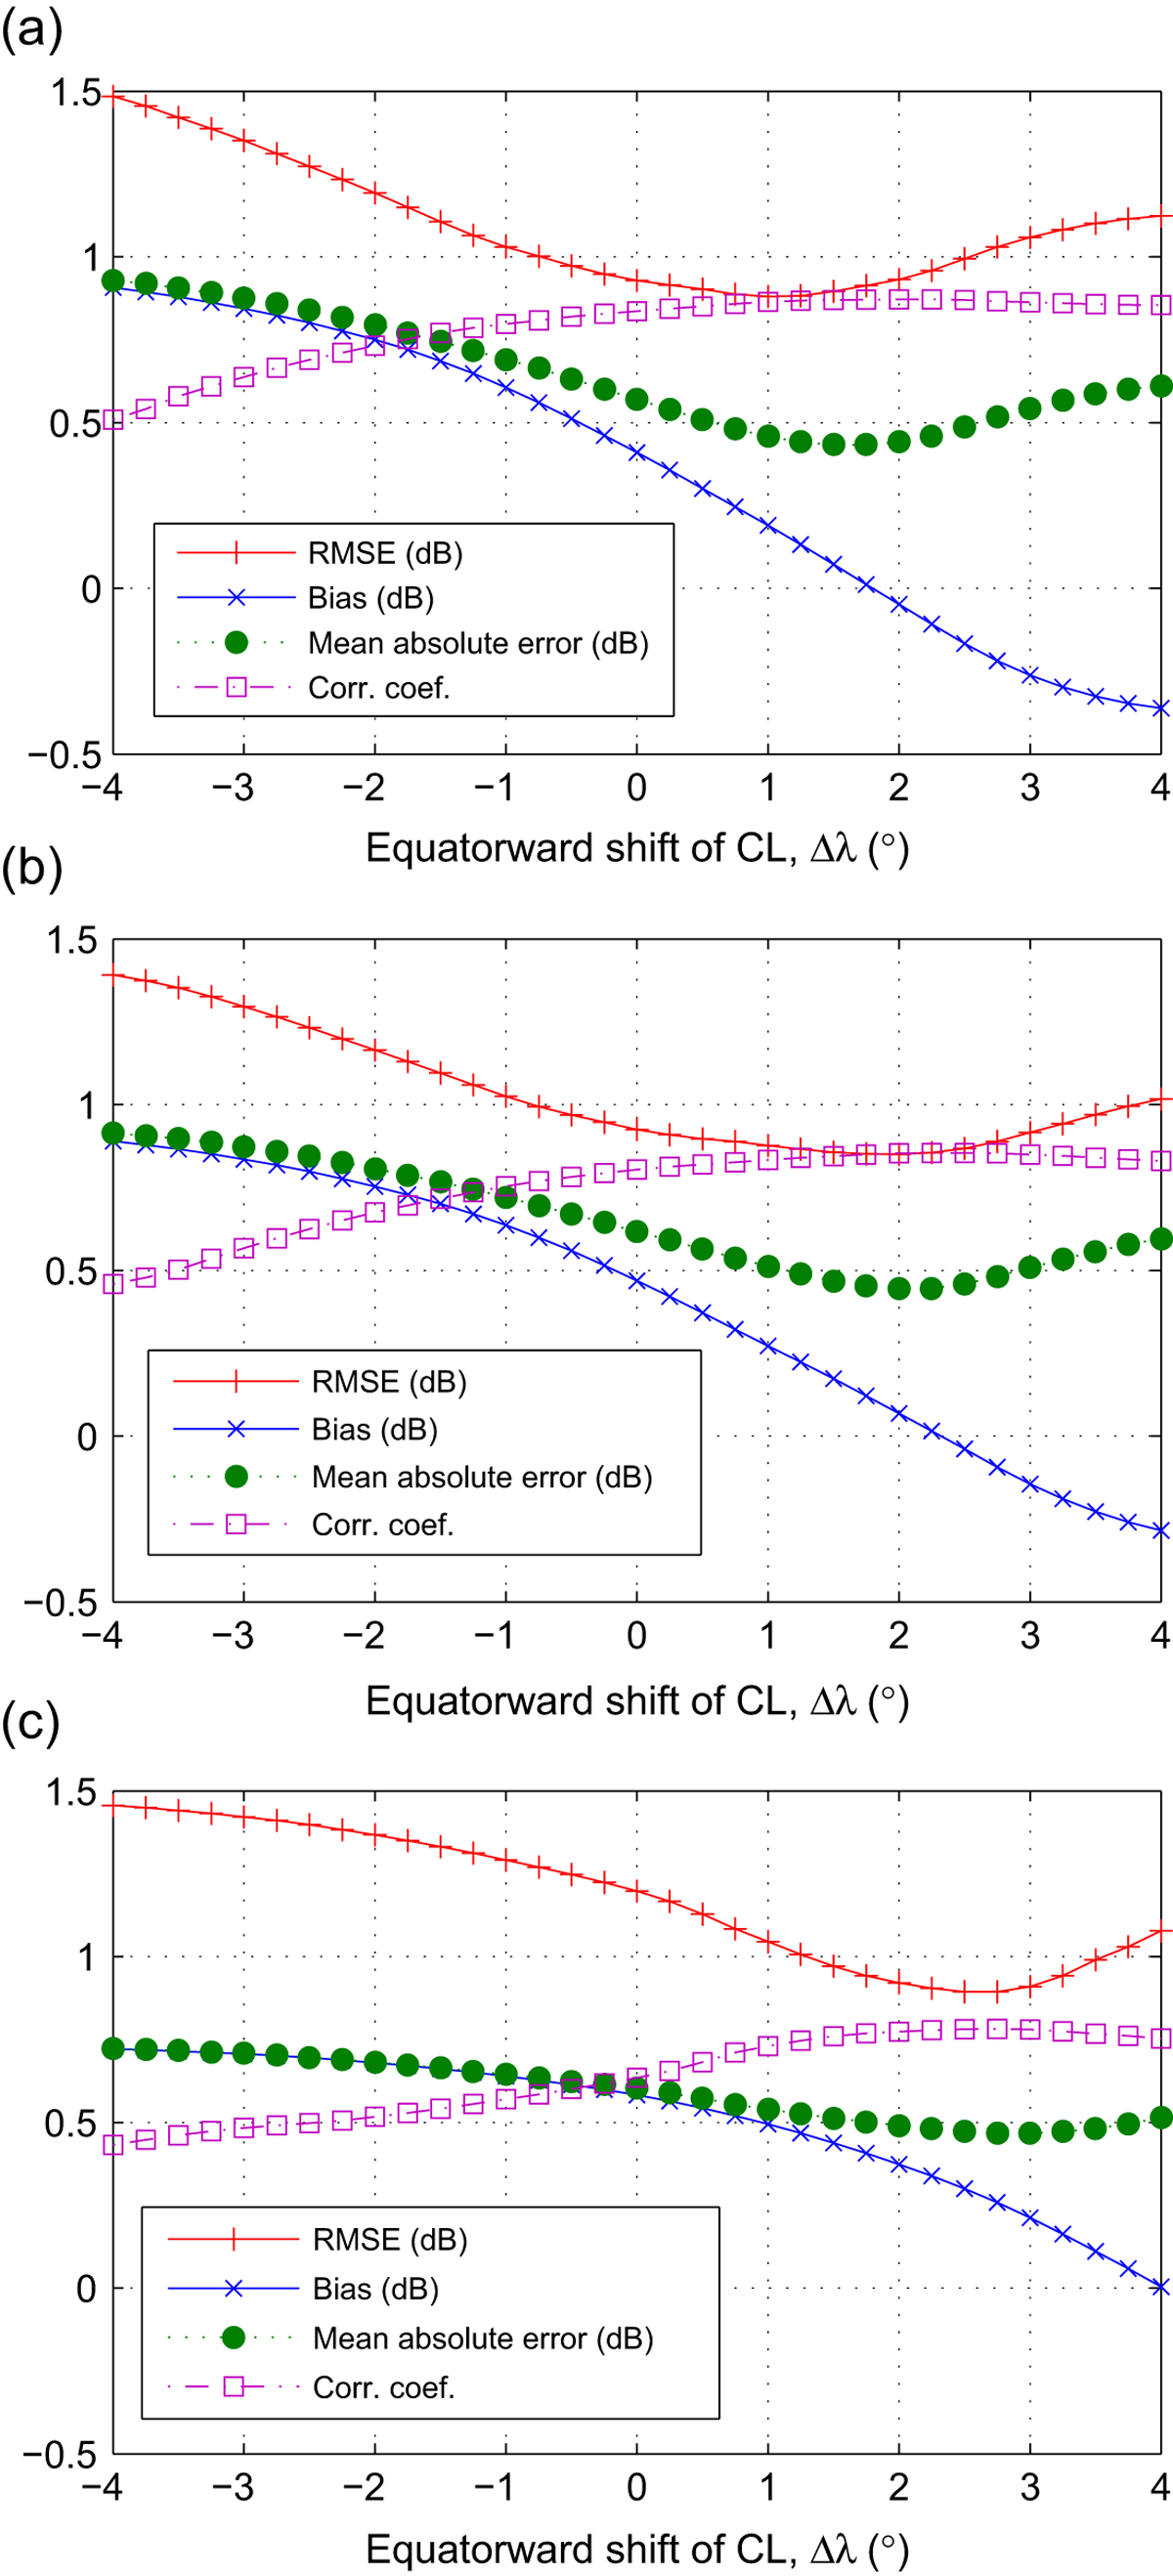
Fig. 7.
Download original image
Errors and correlation coefficients of the DRAP (Sauer & Wilkinson 2008) model with a range of corrections to the CL based on all 94 SPEs. (a) Fort McMurray riometer (L = 5.5), (b) Island Lake riometer (L = 5.5), (c) Pinawa riometer (L = 4.3).
Current usage metrics show cumulative count of Article Views (full-text article views including HTML views, PDF and ePub downloads, according to the available data) and Abstracts Views on Vision4Press platform.
Data correspond to usage on the plateform after 2015. The current usage metrics is available 48-96 hours after online publication and is updated daily on week days.
Initial download of the metrics may take a while.