Fig. 3.
Download original image
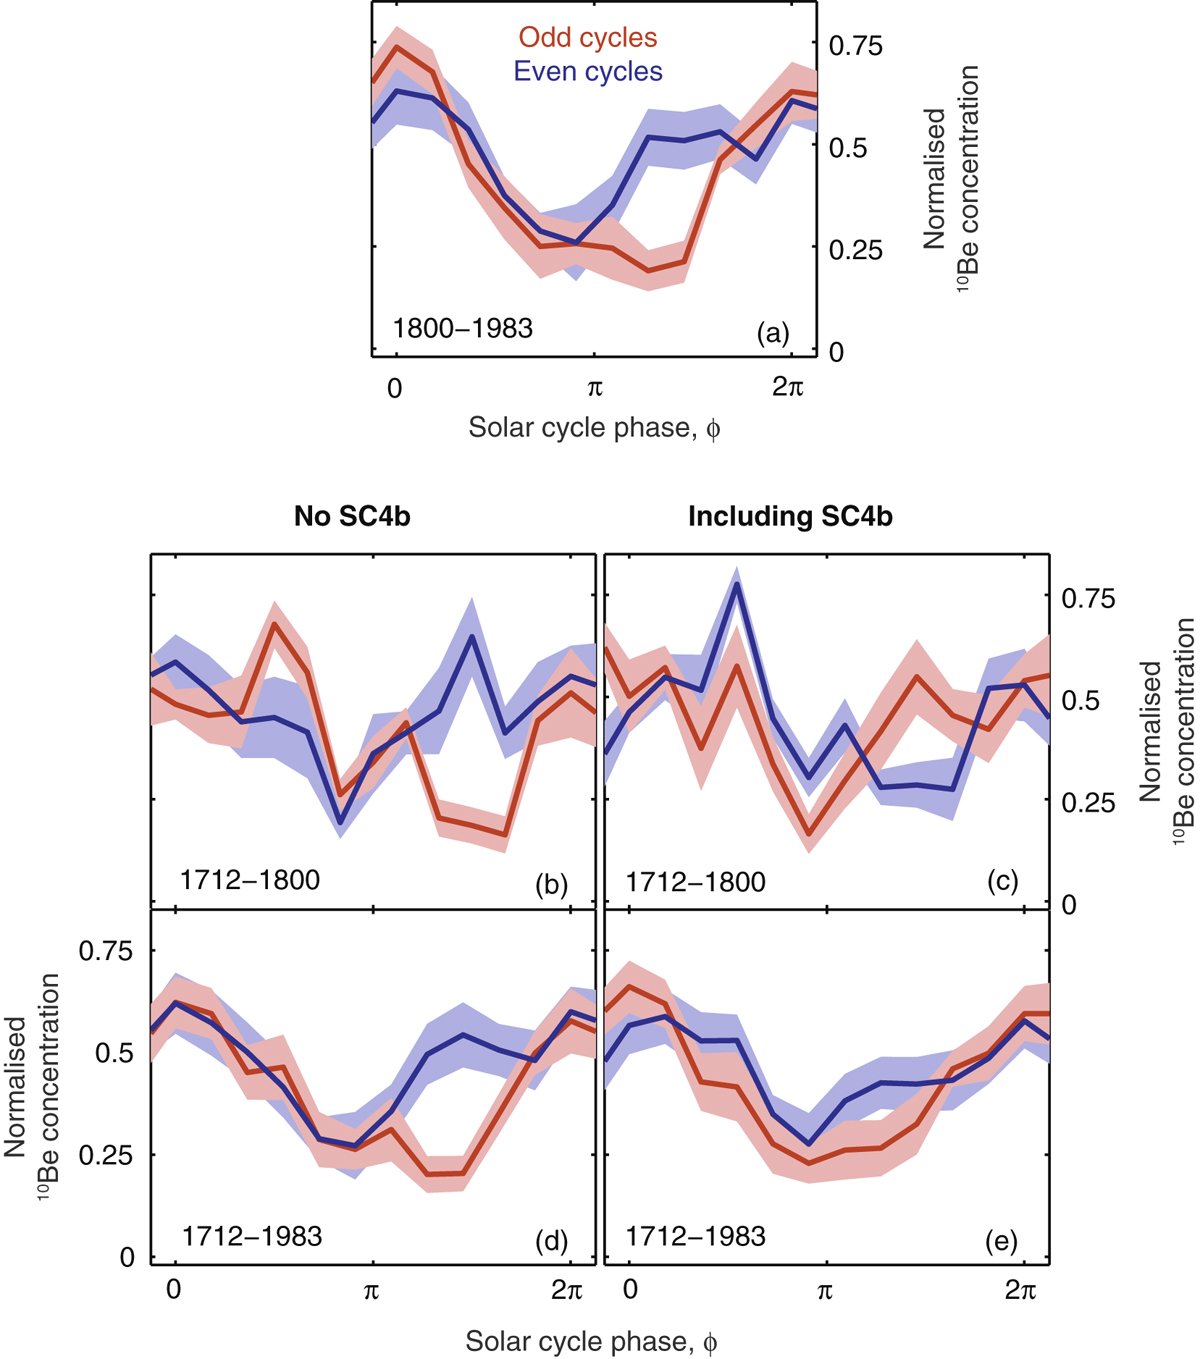
Super-posed epoch plots of 10Be concentration over solar cycles. Panel (a) is simply Figure 2f, repeated for reference. Panels (b) and (d) show solar cycles numbered without the addition of SC4b, while panels (c) and (f) renumber the cycles prior to 1800 to include SC4b. Panels (b) and (c) only show data from the period 1712 to 1800, while panels (d) and (e) cover 1712–2014 (i.e., include the data shown in panel a).
Current usage metrics show cumulative count of Article Views (full-text article views including HTML views, PDF and ePub downloads, according to the available data) and Abstracts Views on Vision4Press platform.
Data correspond to usage on the plateform after 2015. The current usage metrics is available 48-96 hours after online publication and is updated daily on week days.
Initial download of the metrics may take a while.