Fig. 4.
Download original image
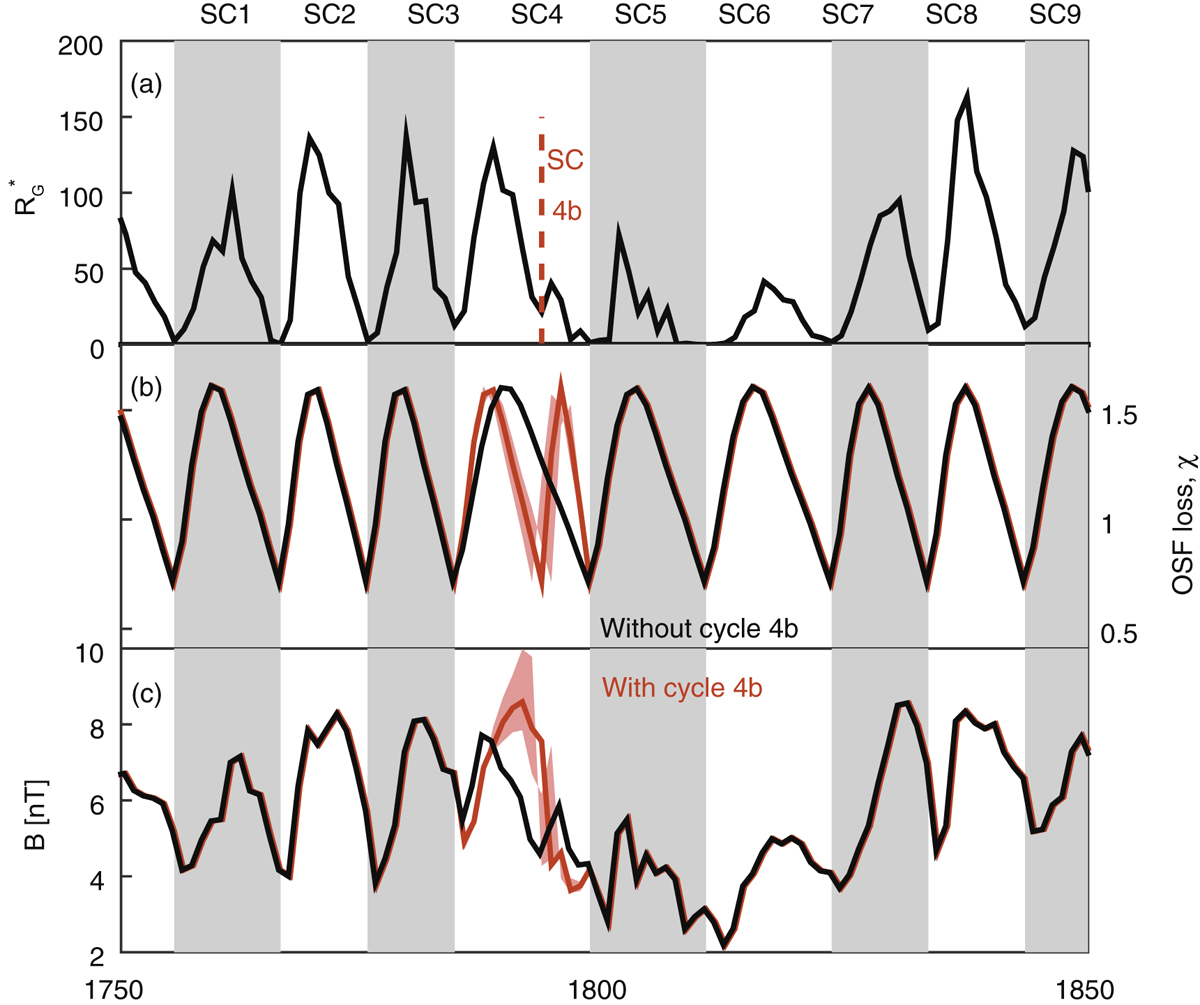
(a) Detail of annual corrected group sunspot number, RG*, for the interval 1750–1850. Alternating white/grey panels show solar cycles (without the putative extra cycle 4b). The proposed start of solar cycle 4b is shown by the red dashed line. (b) Fractional open solar flux loss rate, χ, which is assumed to be purely a function of solar cycle phase. Red (black) lines show χ with (without) the addition of solar cycle 4b. Pink-shaded areas show the range of values obtained by varying the SC4b start date by ± 1 year. (c) Near-Earth magnetic field magnitude, B, from the modelled OSF. In the same format as panel (b).
Current usage metrics show cumulative count of Article Views (full-text article views including HTML views, PDF and ePub downloads, according to the available data) and Abstracts Views on Vision4Press platform.
Data correspond to usage on the plateform after 2015. The current usage metrics is available 48-96 hours after online publication and is updated daily on week days.
Initial download of the metrics may take a while.