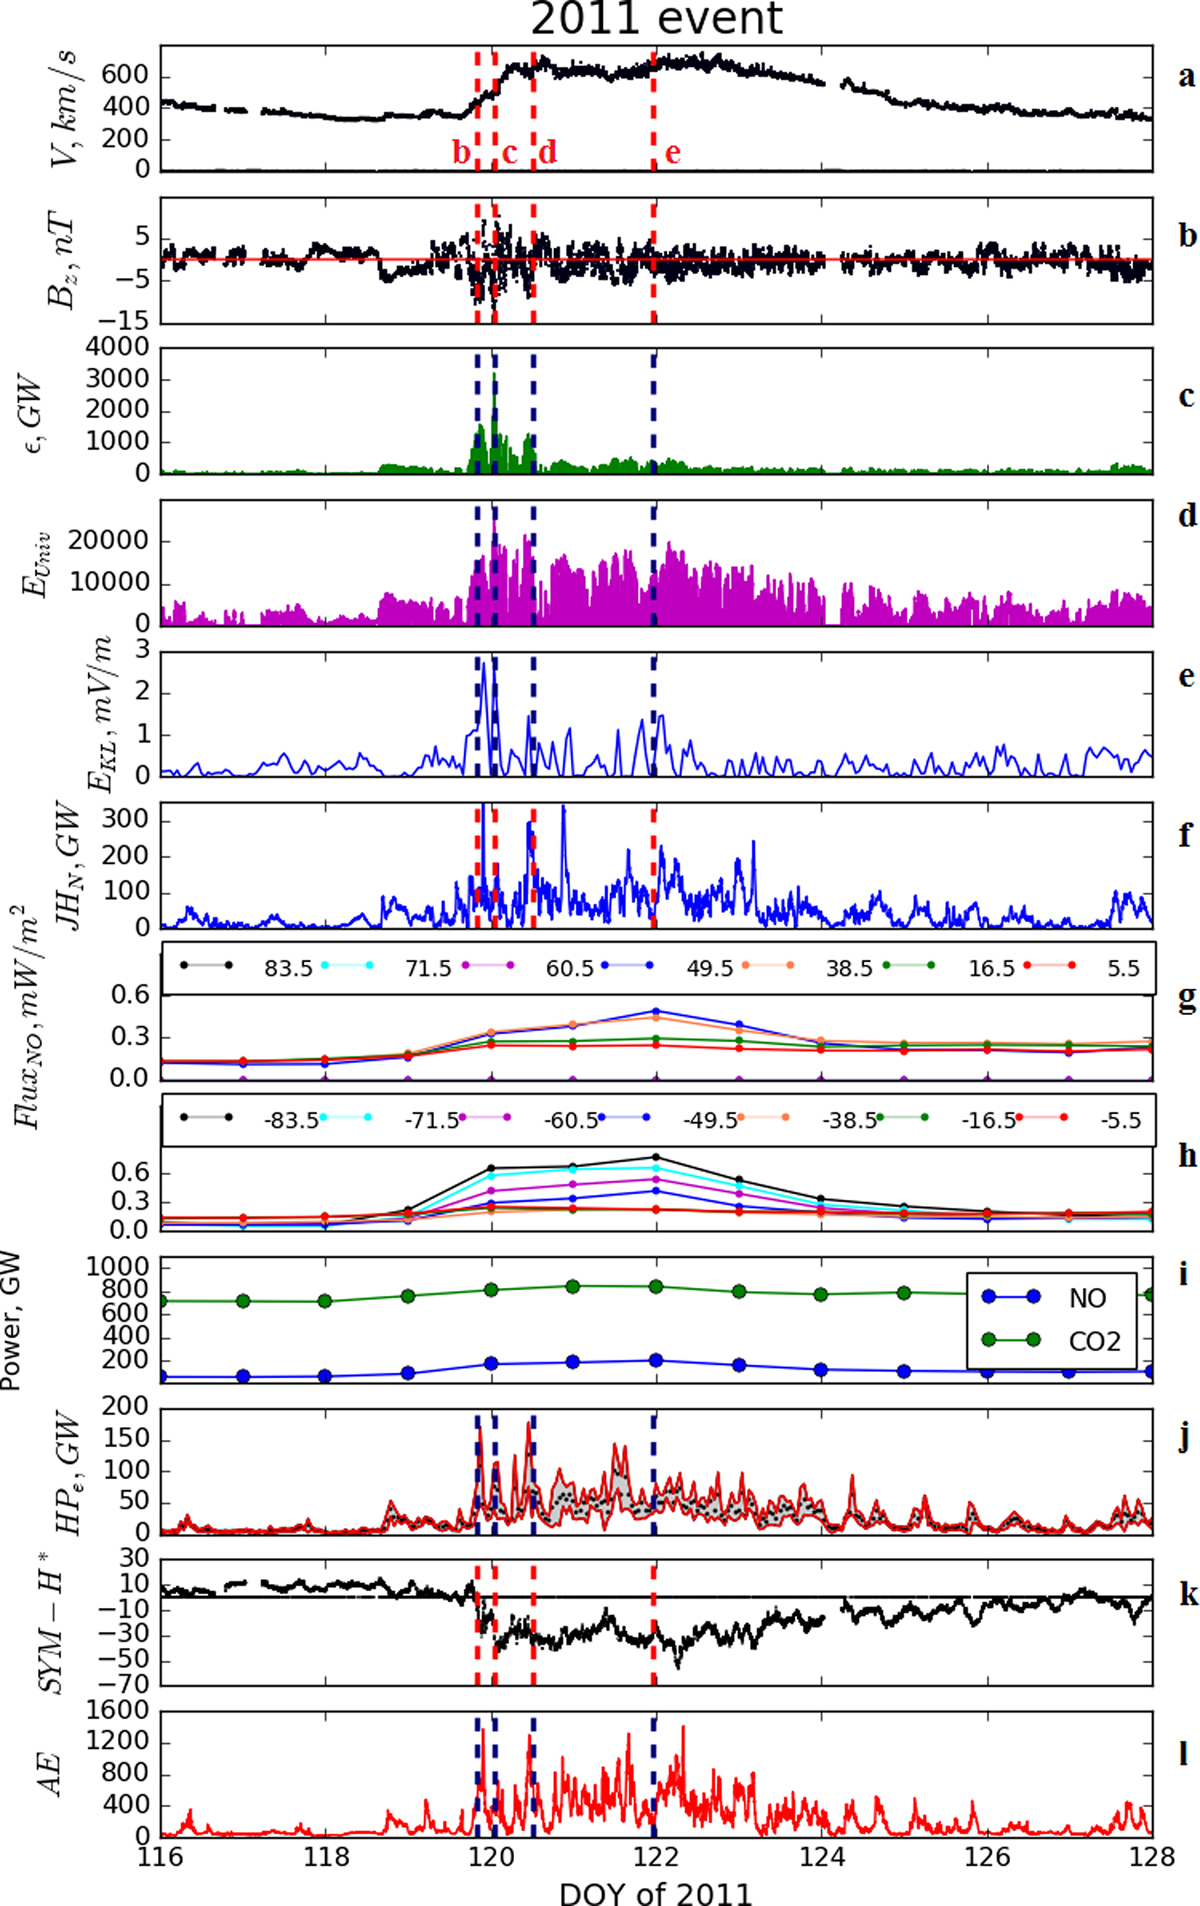
Fig. 2.
Download original image
The same as in Figure 1 but for the 2011 CIR-HSS event. Vertical dashed lines indicate sample times during: the storm main phase (~20:00 UT on 29 April or 119 DOY, snapshot b; ~01:00 UT and 12:00 UT on 30 April or 120 DOY, snapshots c and d) and recovery phase (~23:00 on 1 May or 121 DOY, snapshot e). Snapshot numbering is shown in panel a. See text for details.
Current usage metrics show cumulative count of Article Views (full-text article views including HTML views, PDF and ePub downloads, according to the available data) and Abstracts Views on Vision4Press platform.
Data correspond to usage on the plateform after 2015. The current usage metrics is available 48-96 hours after online publication and is updated daily on week days.
Initial download of the metrics may take a while.