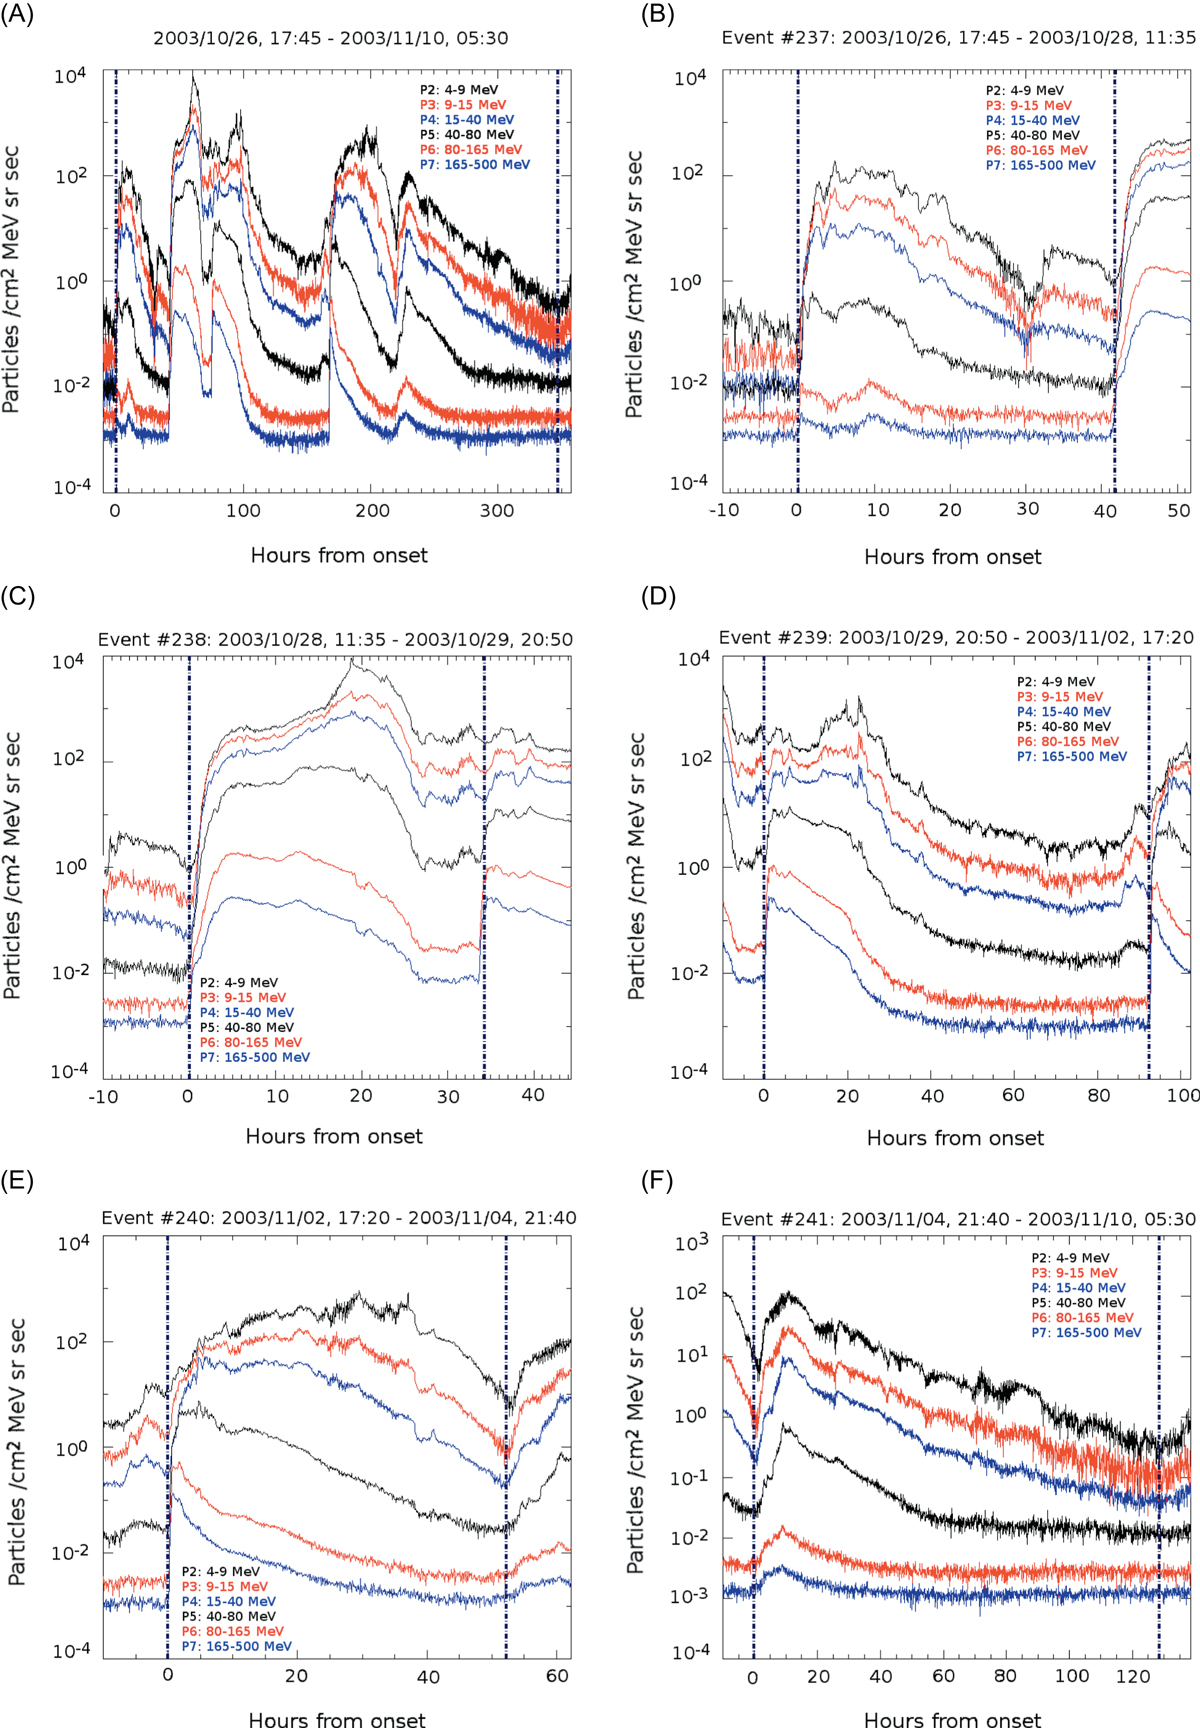
Fig. 1.

Download original image
An illustration of the work scheme for the identification of the SEP events. We present particle recordings, reported onboard GOES/EPS at a wide energy range from 4–500 MeV (i.e. P2–P7; see legends in each panel for details). (A) The outcome of the automated procedure for the identification of SEP events for the October 2003 period. (B–F) The outputs of the manual break. Vertical lines mark the start and end time of the event as identified in this work; titles in each sub-panels provide the number of the event as well the start and end time; the ordinate in all panels presents the proton intensities (in particles/cm2 sr sec MeV) and the abscissa presents the time in hours from the onset time, the latter labelled with the first vertical line in each sub-panel.
Current usage metrics show cumulative count of Article Views (full-text article views including HTML views, PDF and ePub downloads, according to the available data) and Abstracts Views on Vision4Press platform.
Data correspond to usage on the plateform after 2015. The current usage metrics is available 48-96 hours after online publication and is updated daily on week days.
Initial download of the metrics may take a while.


