Fig. 13.
Download original image
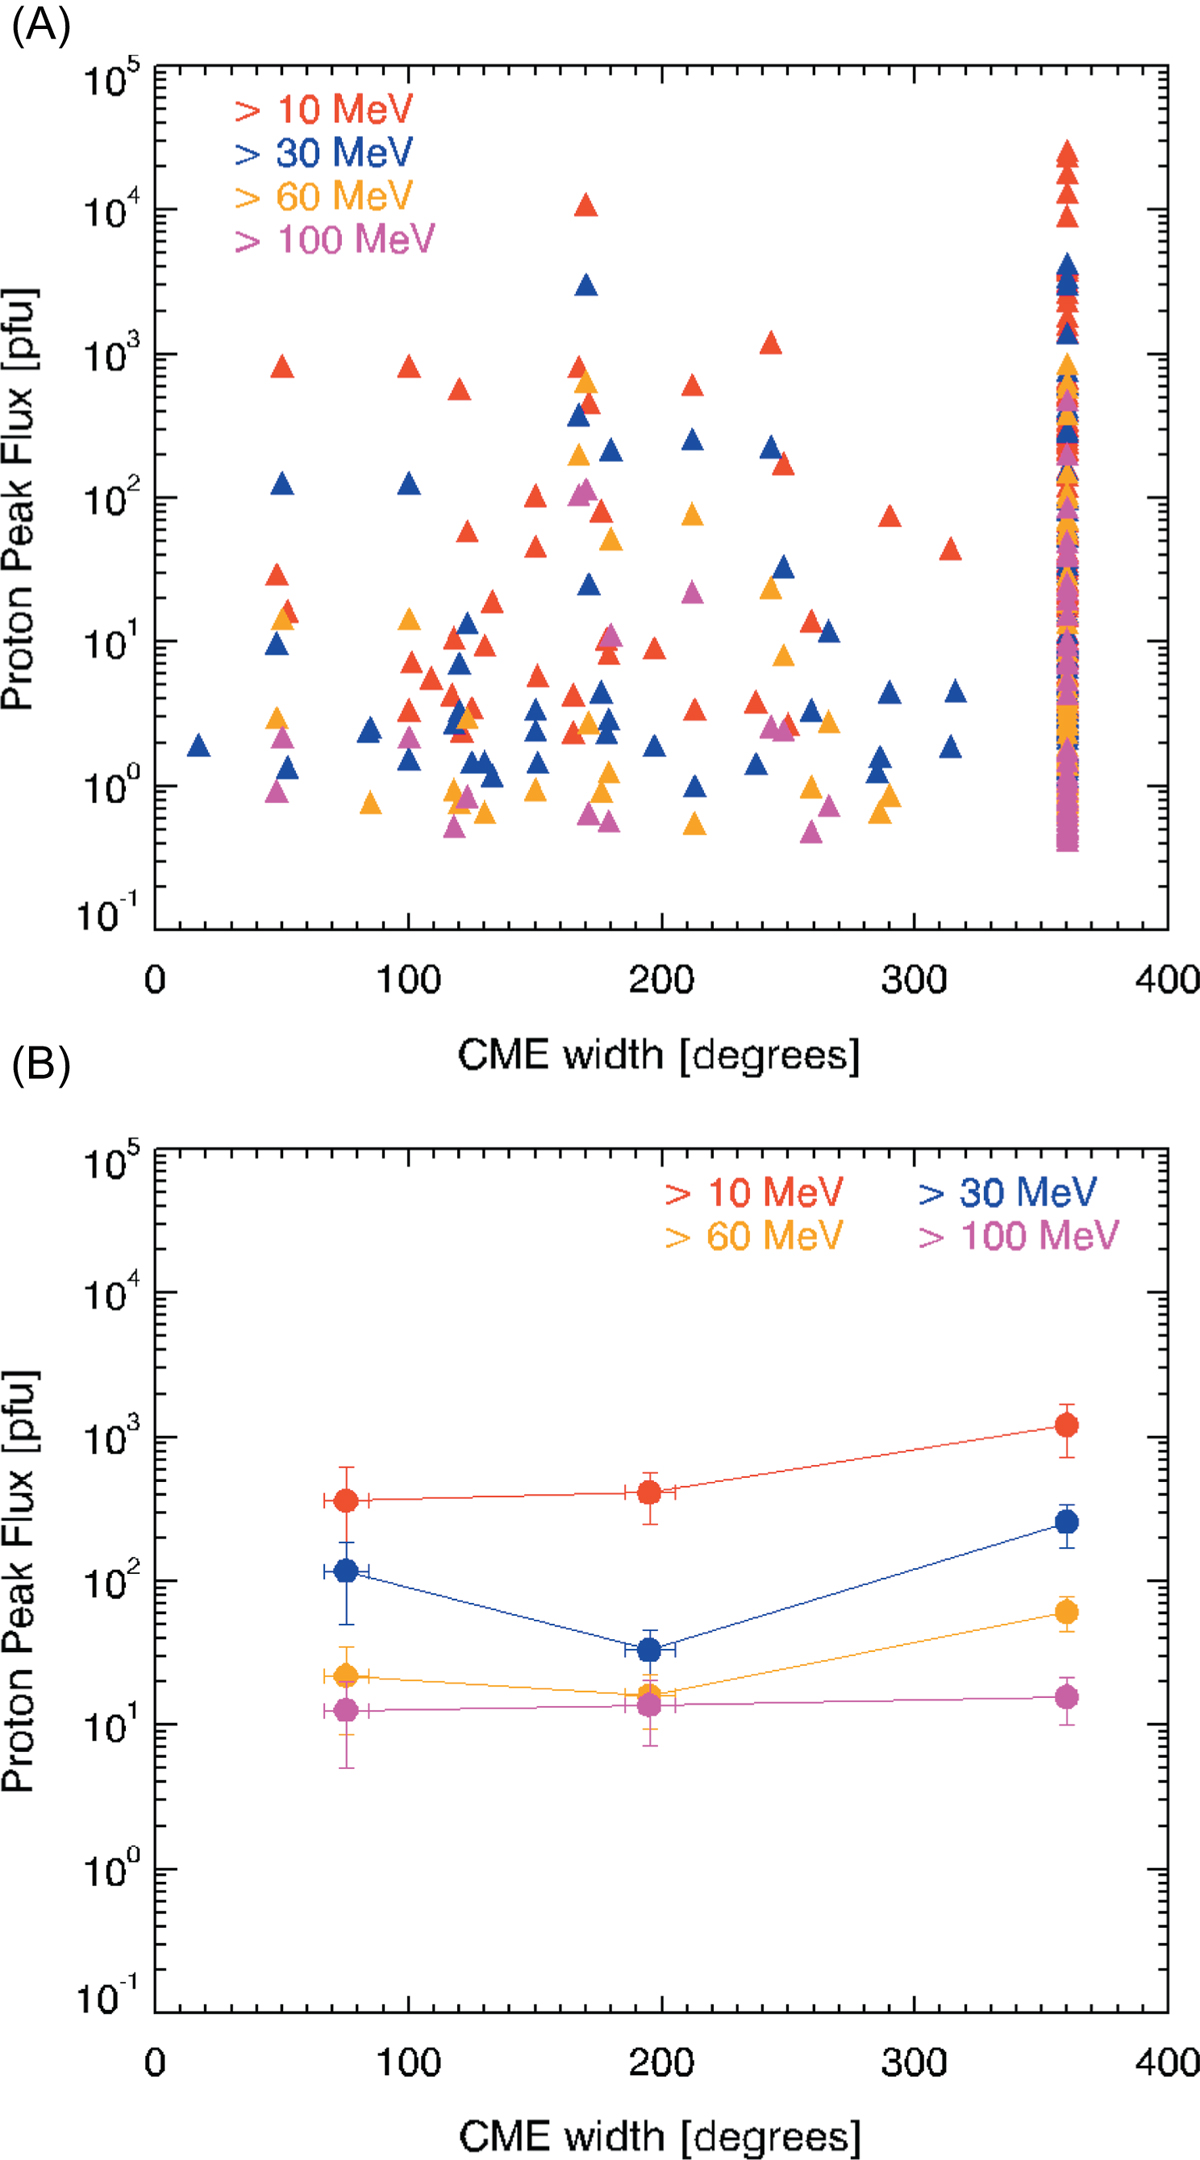
(A) Scatter plot of the proton peak fluxes (in pfu) at several integral energies (E > 10; 30; 60 and 100 MeV) as a function of the CME width (in degrees) for the CMEs associated with SEP events in the SEP part of the database. (B) Mean values of the proton peak flux (in pfu) and their respective standard deviation of the mean, as a function of the CME width (in degrees). Each integral energy is color coded as in Figure 8.
Current usage metrics show cumulative count of Article Views (full-text article views including HTML views, PDF and ePub downloads, according to the available data) and Abstracts Views on Vision4Press platform.
Data correspond to usage on the plateform after 2015. The current usage metrics is available 48-96 hours after online publication and is updated daily on week days.
Initial download of the metrics may take a while.