Fig. 15.
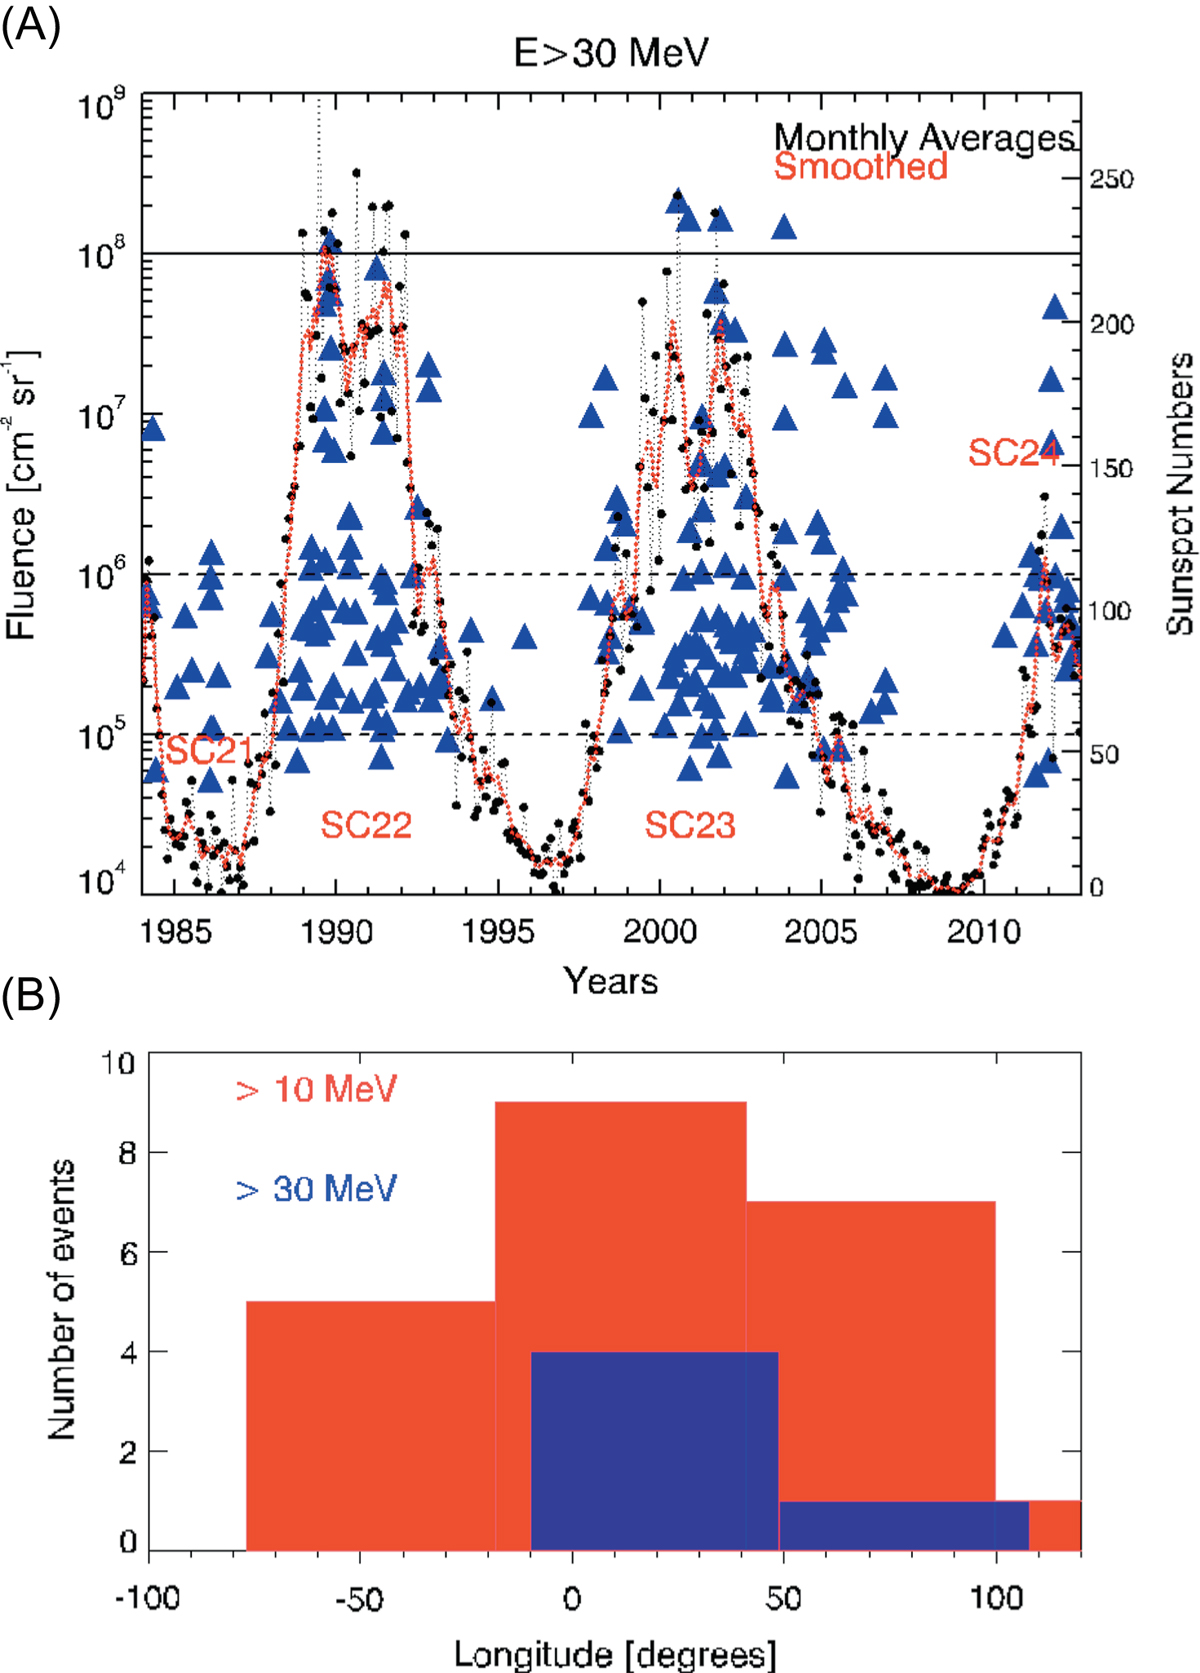
Download original image
(A) The fluence of the SEP events at E > 30 MeV observed from 1984 to 2013 as a function of time. The dashed horizontal lines indicate the zone of the most commonly identified fluence values that falls between 105 and 106 cm−2 sr−1. The solid horizontal black line marks an extreme fluence level at 108 cm−2 sr−1. The black filled circles correspond to the monthly averaged sunspot numbers and the red smoothed curve depicts the evolution of the solar cycles from 1984–2013. Each solar cycle is marked on the plot. (B) Distribution of the SEP events with fluence ≥108 cm−2 sr−1 at an integral energy of E > 10 MeV (red color) and >30 MeV (blue color) as a function of the longitude of the associated solar flares (in degrees).
Current usage metrics show cumulative count of Article Views (full-text article views including HTML views, PDF and ePub downloads, according to the available data) and Abstracts Views on Vision4Press platform.
Data correspond to usage on the plateform after 2015. The current usage metrics is available 48-96 hours after online publication and is updated daily on week days.
Initial download of the metrics may take a while.