Fig. 16.
Download original image
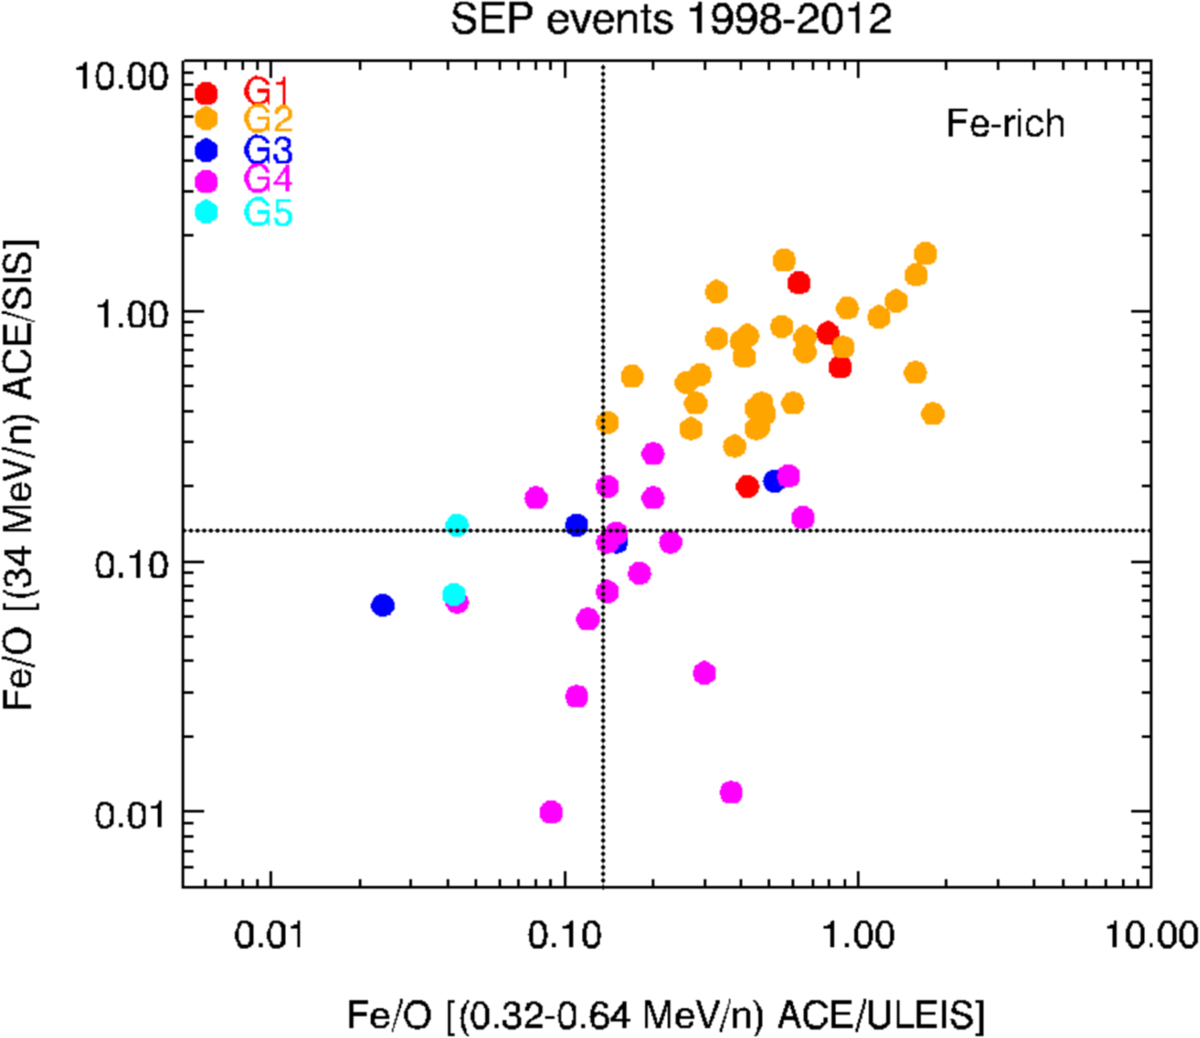
The Fe/O ratio at 34 MeV/n against that at 0.32–0.64 MeV/n for the SEP events from 1998–2012. The dashed black lines indicate the average Fe/O value of 0.134 (Reames 1995). The 34 MeV/n data are from ACE/SIS and the 0.32–0.64 MeV/n data from ACE/ULEIS. The five groups, i.e. G1–G5, as defined by Cane et al. (2010), are color coded on the plot. The events attributed to each group follow the same color code. The plot extends from 1998 to 2012. There are two events in our catalogue, identified in 1997 and another two events in 2013. However, in the first case ACE/ULEIS presented data gaps while in the second one, there is a data gap of Fe at ACE/SIS at 34 MeV/n.
Current usage metrics show cumulative count of Article Views (full-text article views including HTML views, PDF and ePub downloads, according to the available data) and Abstracts Views on Vision4Press platform.
Data correspond to usage on the plateform after 2015. The current usage metrics is available 48-96 hours after online publication and is updated daily on week days.
Initial download of the metrics may take a while.