Open Access
Fig. 17.
Download original image
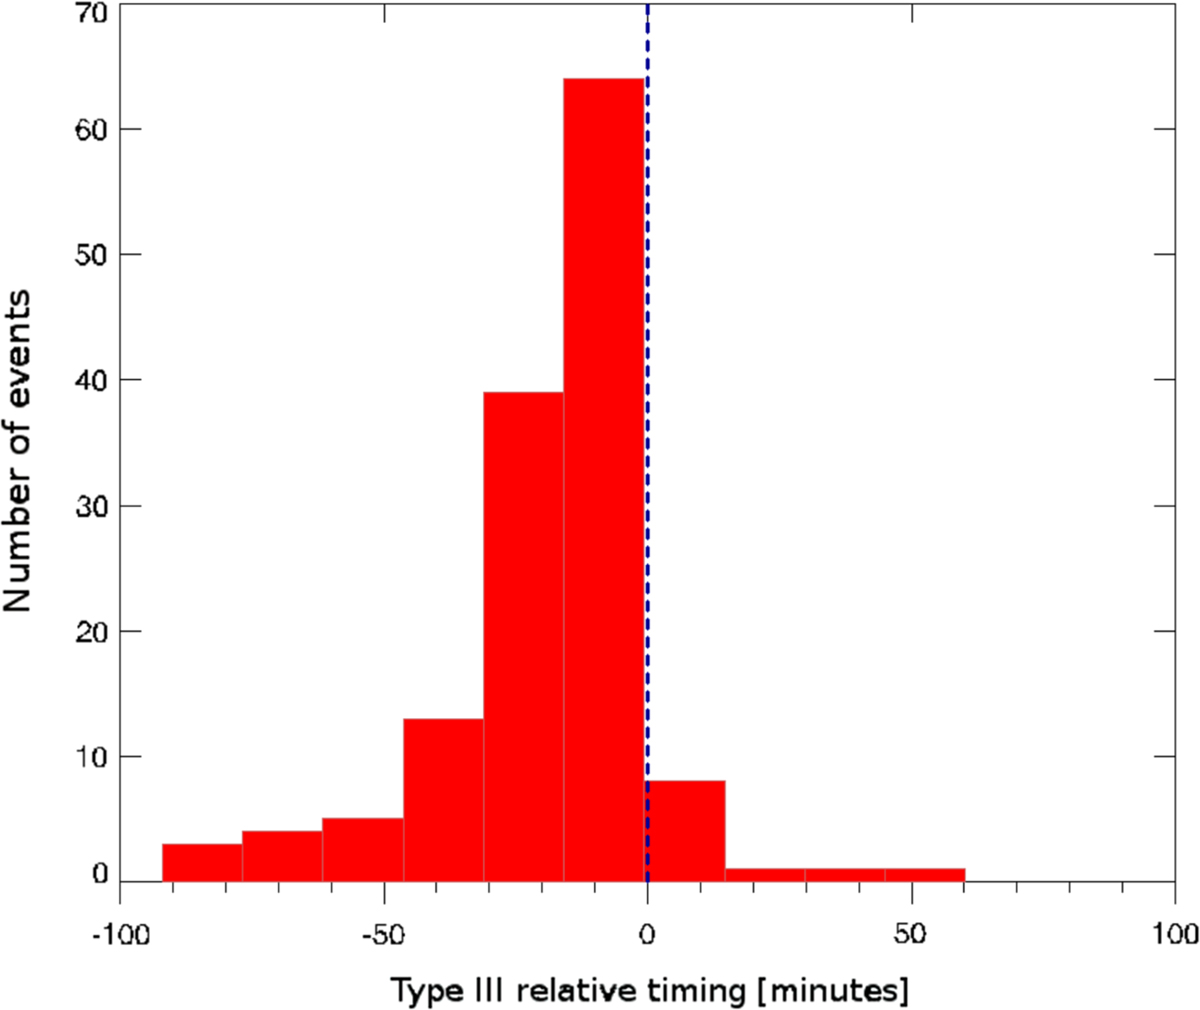
Distribution of the SEP events with respect to ![]() . Events to the left of the vertical dashed blue line had associated type III events that started prior to the time of the SXR peak flux, while events to the right of the vertical dashed blue line had associated type III events that occurred after the time of the SXR peak flux.
. Events to the left of the vertical dashed blue line had associated type III events that started prior to the time of the SXR peak flux, while events to the right of the vertical dashed blue line had associated type III events that occurred after the time of the SXR peak flux.
Current usage metrics show cumulative count of Article Views (full-text article views including HTML views, PDF and ePub downloads, according to the available data) and Abstracts Views on Vision4Press platform.
Data correspond to usage on the plateform after 2015. The current usage metrics is available 48-96 hours after online publication and is updated daily on week days.
Initial download of the metrics may take a while.