Fig. 20.
Download original image
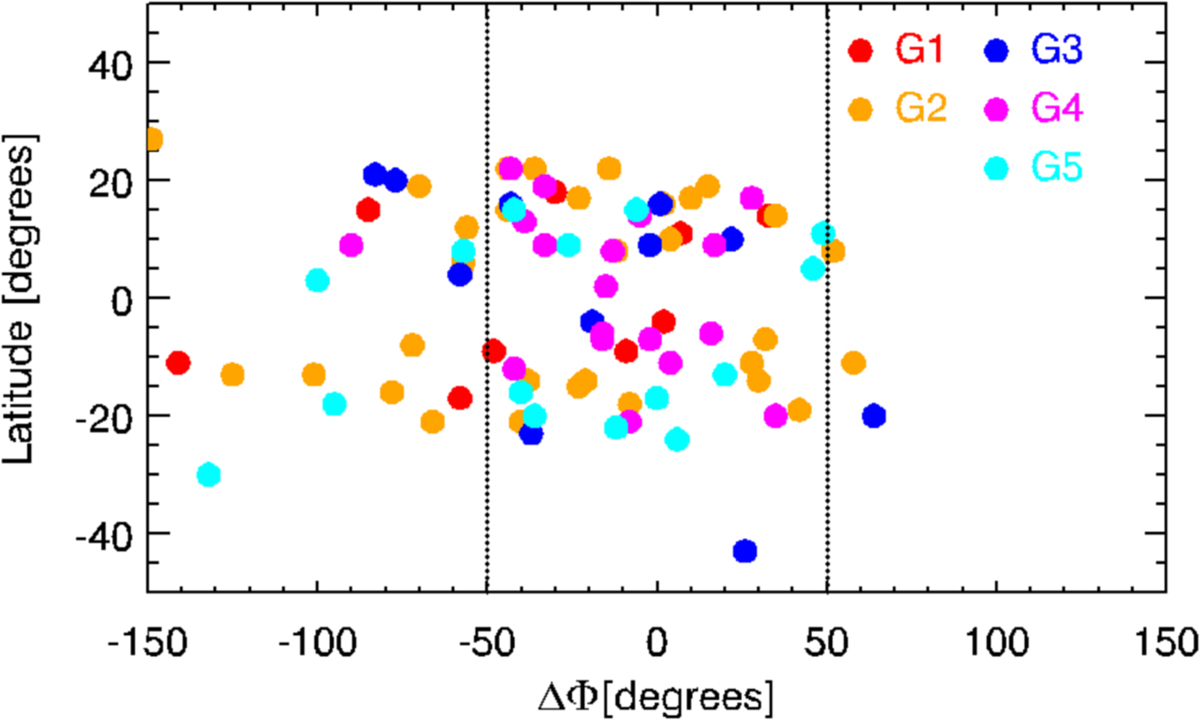
Distribution of the flare locations with respect to the longitudinal distance of the solar flare from the footpoint of the Parker spiral leading to L1 point (ΔΦ). The dashed lines indicate a “cone of observations” within [−50°, 50°]. The five groups, i.e. G1–G5, are color coded on the plot. The events attributed to each group follow the same color code.
Current usage metrics show cumulative count of Article Views (full-text article views including HTML views, PDF and ePub downloads, according to the available data) and Abstracts Views on Vision4Press platform.
Data correspond to usage on the plateform after 2015. The current usage metrics is available 48-96 hours after online publication and is updated daily on week days.
Initial download of the metrics may take a while.