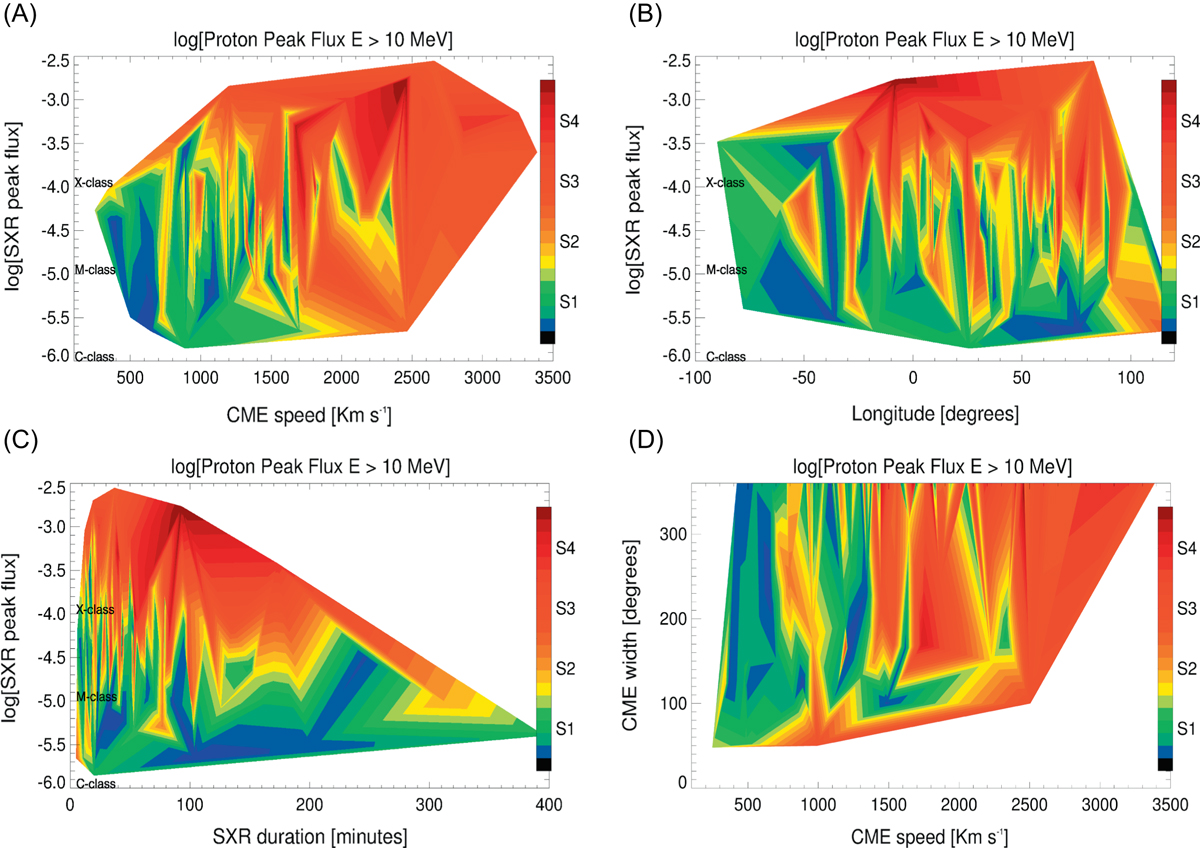
Fig. 21.
Download original image
Contour plots of the logarithm of the proton peak flux at E > 10 MeV as a function of different pairs of variables. In particular, the variation of the logarithm of the proton peak flux at E > 10 MeV, as a function of the speed of the CME and the logarithm of the SXR peak flux is depicted at (A). (B) The variation, as a function of the longitude and the magnitude (SXR peak flux) of the parent solar flare. (C) The dependence of the logarithm of the proton peak flux at E > 10 MeV, as a function of the duration and the magnitude (e.g. SXR peak flux) of the parent solar flare and (D) presents the dependence, as a function of the speed and the width of the associated CME event. The color bar at each panel marks the different levels of radiation storms, as those are defined by NOAA, labelled with S1 to S4. See text for details.
Current usage metrics show cumulative count of Article Views (full-text article views including HTML views, PDF and ePub downloads, according to the available data) and Abstracts Views on Vision4Press platform.
Data correspond to usage on the plateform after 2015. The current usage metrics is available 48-96 hours after online publication and is updated daily on week days.
Initial download of the metrics may take a while.