Fig. 3.
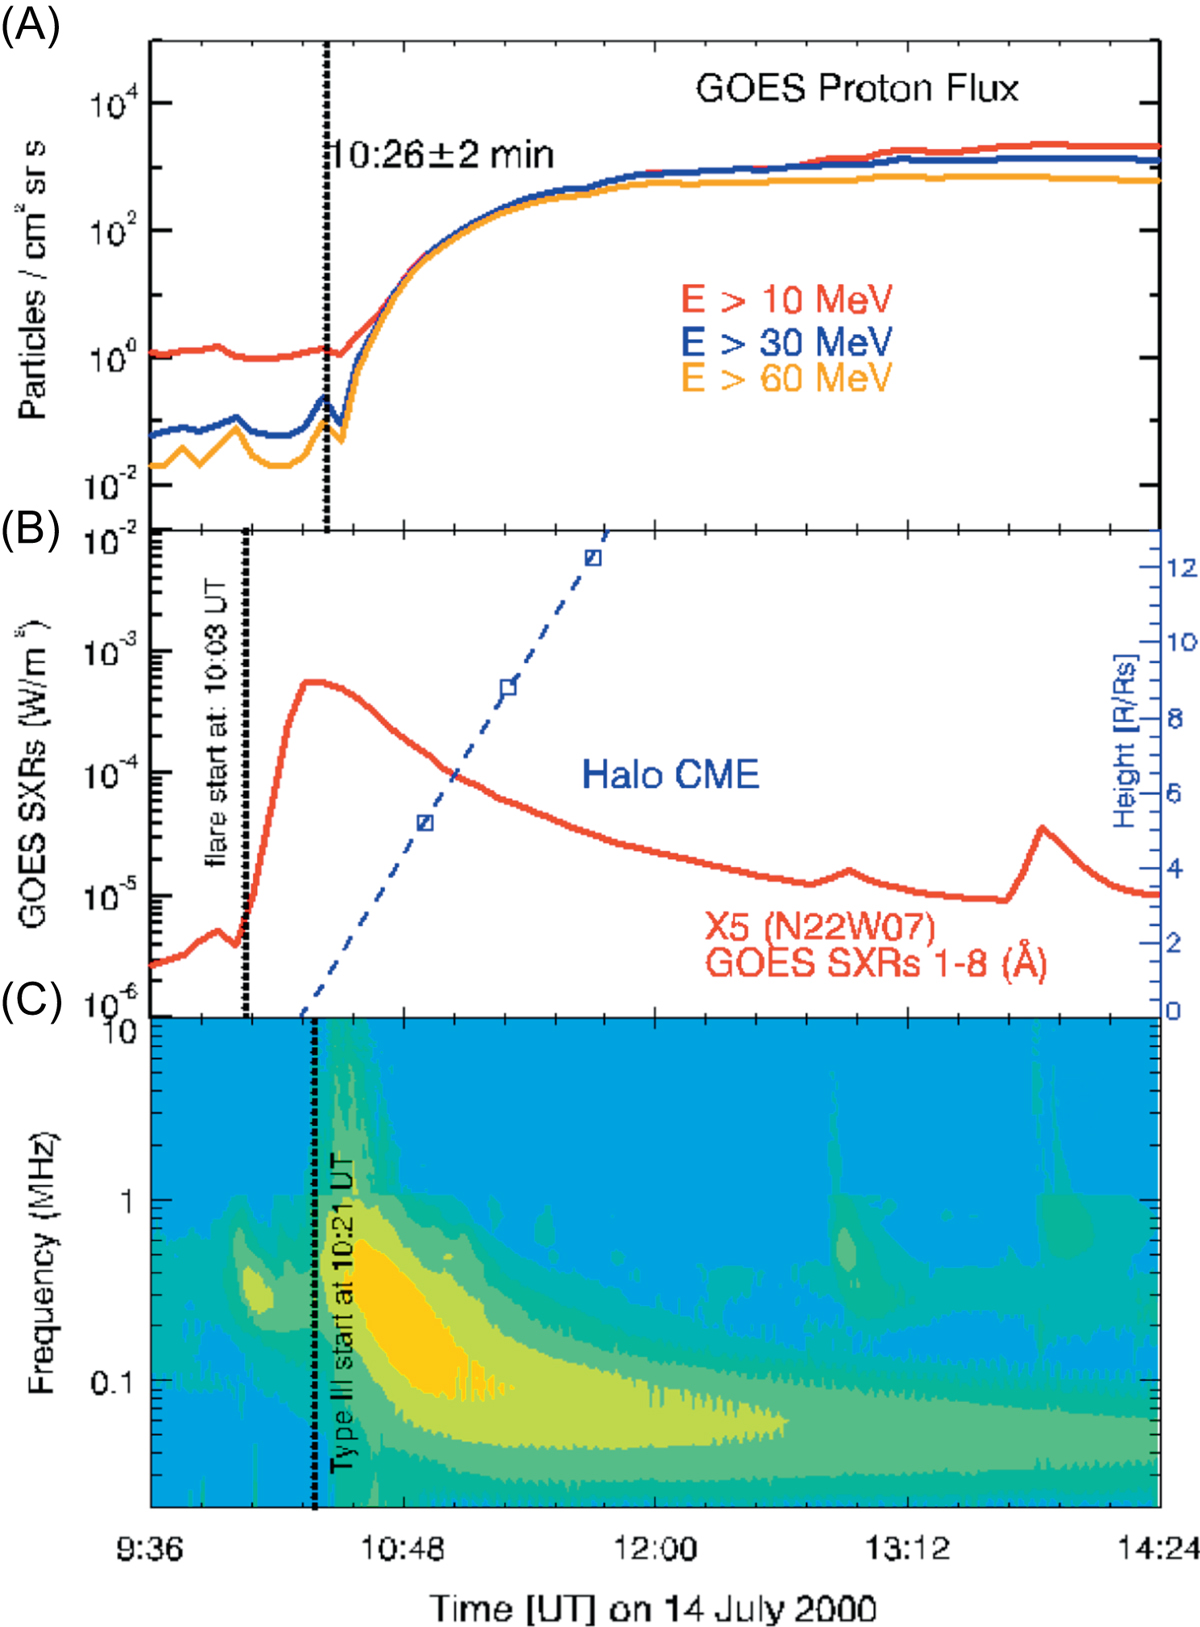
Download original image
Event no. 169 of Table 2 (supplementary online material). (A) The GOES proton flux at E > 10, >30 and >60 MeV (red, blue and orange lines, respectively). The black dashed vertical line corresponds to the anticipated solar release time for this event (shifted by 500 s to allow the comparison with the EM emissions). (B) The SXRs flux observed by GOES, denoting an X5 solar flare at N22W07 (red curve; left axis). The black dashed vertical line corresponds to the start time of the solar flare. The dashed blue line provides the height-time plot of the CME leading edge observed by SOHO/LASCO (blue line; right axis), extrapolated back to the surface of the Sun. (C) Radio flux observed by Wind/WAVES. The dashed black line corresponds to the start time of the identified type III burst.
Current usage metrics show cumulative count of Article Views (full-text article views including HTML views, PDF and ePub downloads, according to the available data) and Abstracts Views on Vision4Press platform.
Data correspond to usage on the plateform after 2015. The current usage metrics is available 48-96 hours after online publication and is updated daily on week days.
Initial download of the metrics may take a while.