Fig. 5.
Download original image
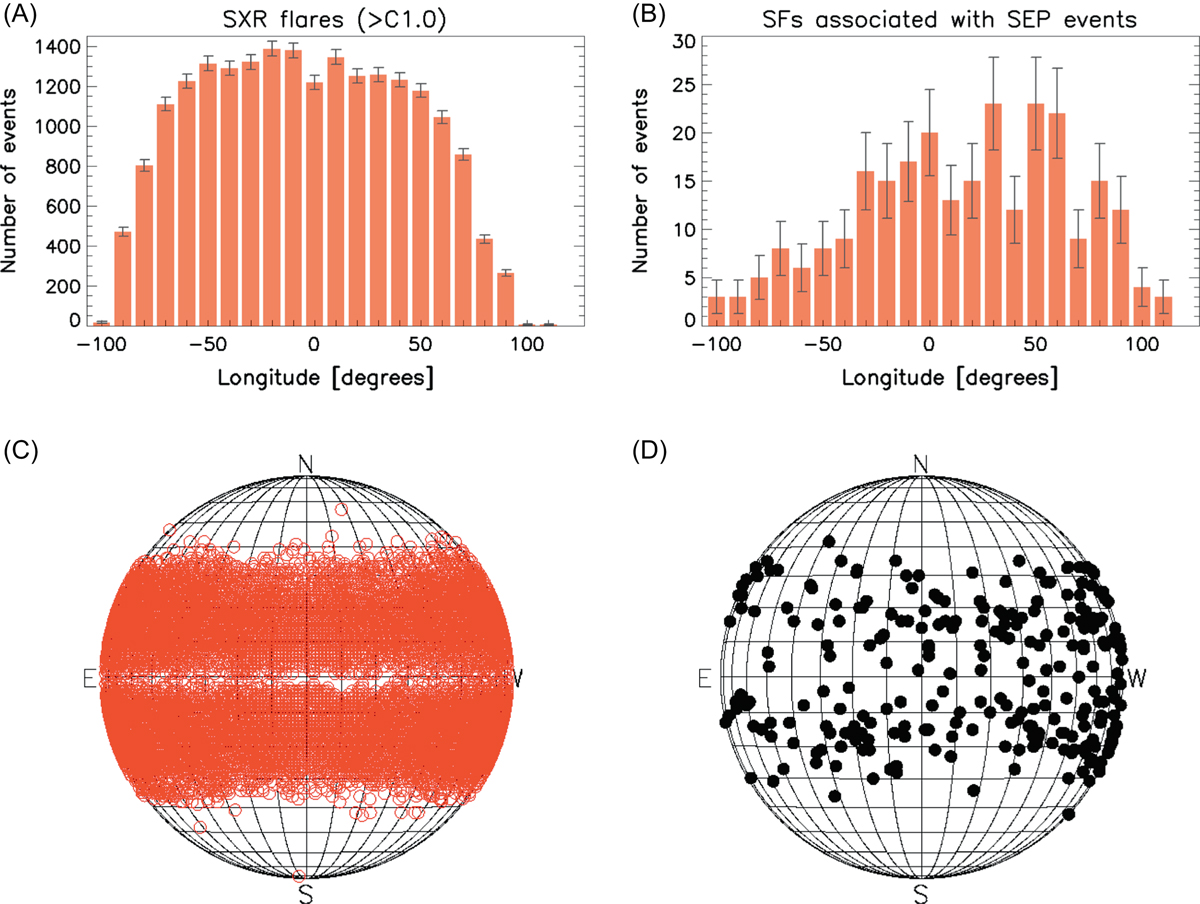
Distribution of the solar flare heliolongitudes (in 10° bins) for all 20 429 > C1.0 flares in our sample from 1984–2013 (A) and for the 314 SEP events (B). The error bars denote the statistical error. Solar flare latitude (in degrees) as a function of the flare longitude (in degrees) for all 20 429 > C1.0 flares in our database from 1984–2013 (red open circles) (C) and for the 314 SEP events (black filled circles) (D).
Current usage metrics show cumulative count of Article Views (full-text article views including HTML views, PDF and ePub downloads, according to the available data) and Abstracts Views on Vision4Press platform.
Data correspond to usage on the plateform after 2015. The current usage metrics is available 48-96 hours after online publication and is updated daily on week days.
Initial download of the metrics may take a while.