Open Access
Fig. 2.
Download original image
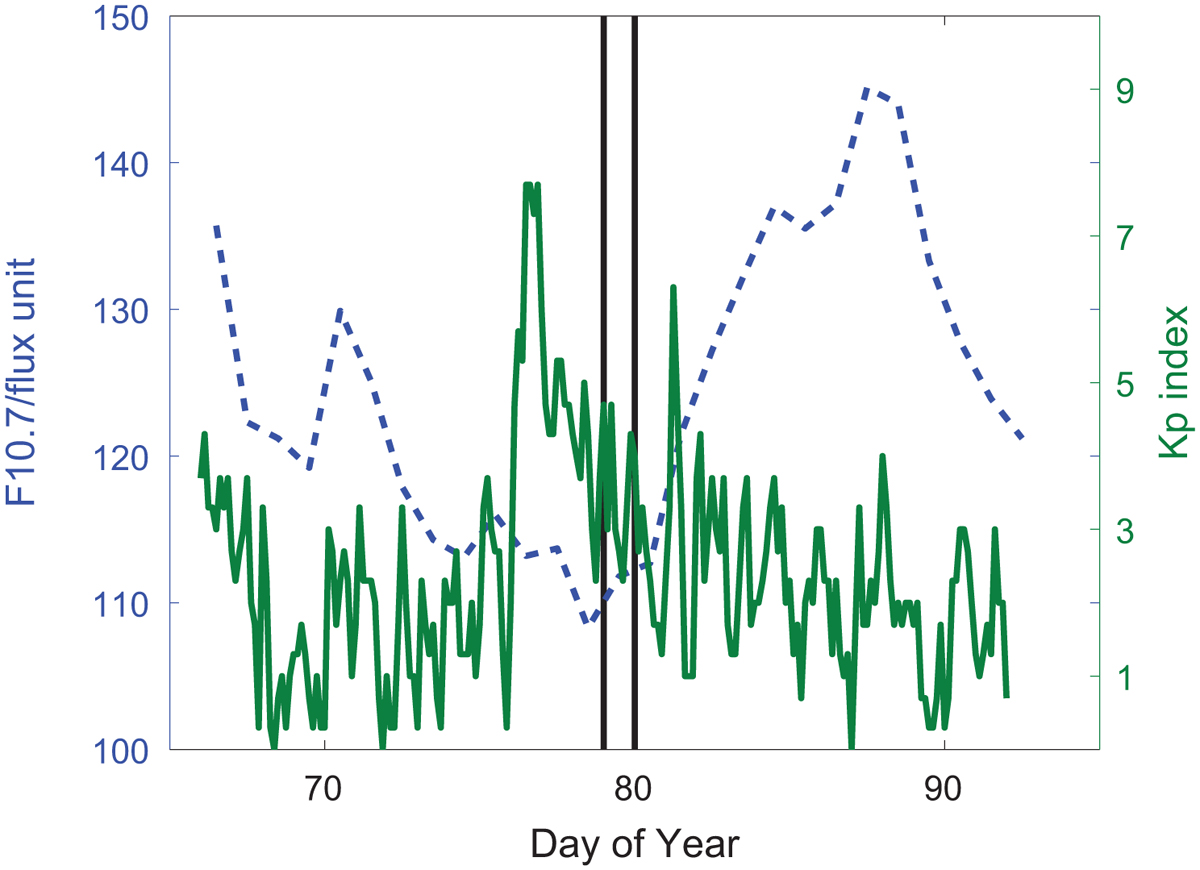
Solar radio flux F10.7 and geomagnetic activity index Kp variations before and after the solar eclipse day on March 20, 2015 marked by a pair of black vertical lines.
Current usage metrics show cumulative count of Article Views (full-text article views including HTML views, PDF and ePub downloads, according to the available data) and Abstracts Views on Vision4Press platform.
Data correspond to usage on the plateform after 2015. The current usage metrics is available 48-96 hours after online publication and is updated daily on week days.
Initial download of the metrics may take a while.