Fig. 3
Download original image
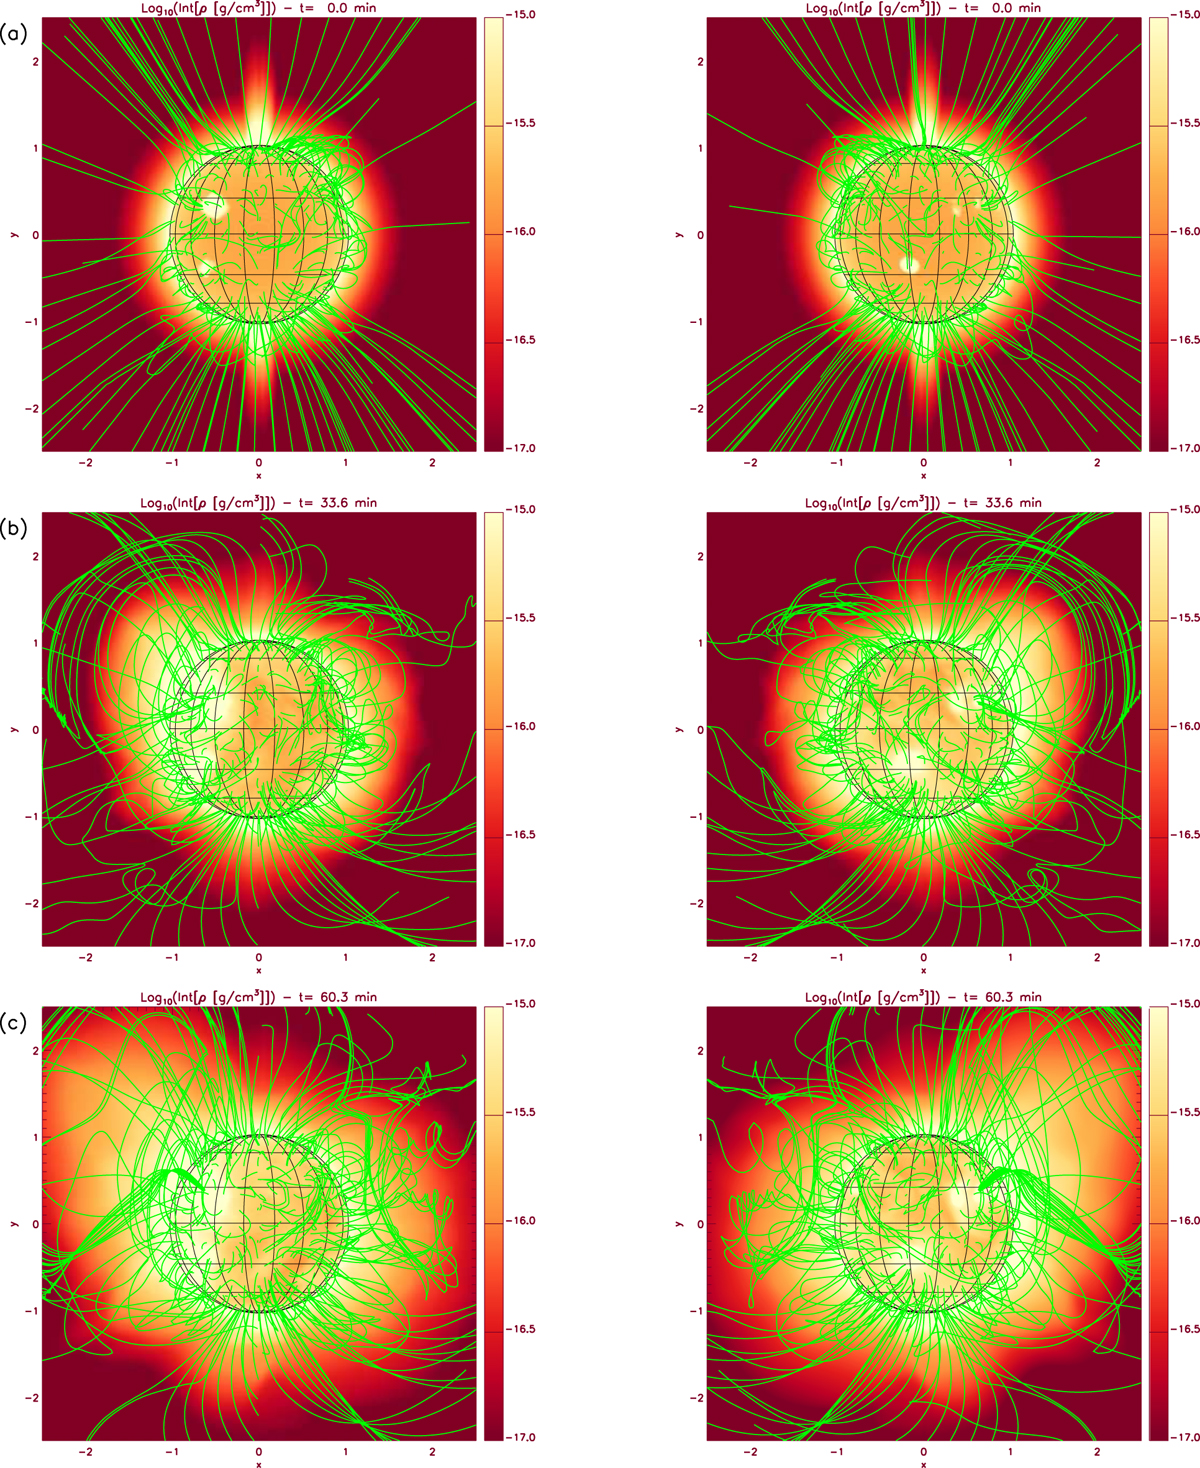
Maps of the column density seen from either side of the Sun in the MHD simulation along with some superimposed magnetic field lines traced from the lower boundary (green) at t = 0 min (a), t = 33.6 min (b), and t = 60.3 min (c). Central meridian for left-hand side panels is at ϕ = 90∘ and at ϕ = 270° for right-hand sided panels and the FOVs are chosen to be same as in Figure 1.
Current usage metrics show cumulative count of Article Views (full-text article views including HTML views, PDF and ePub downloads, according to the available data) and Abstracts Views on Vision4Press platform.
Data correspond to usage on the plateform after 2015. The current usage metrics is available 48-96 hours after online publication and is updated daily on week days.
Initial download of the metrics may take a while.