Open Access
Fig. 2
Download original image
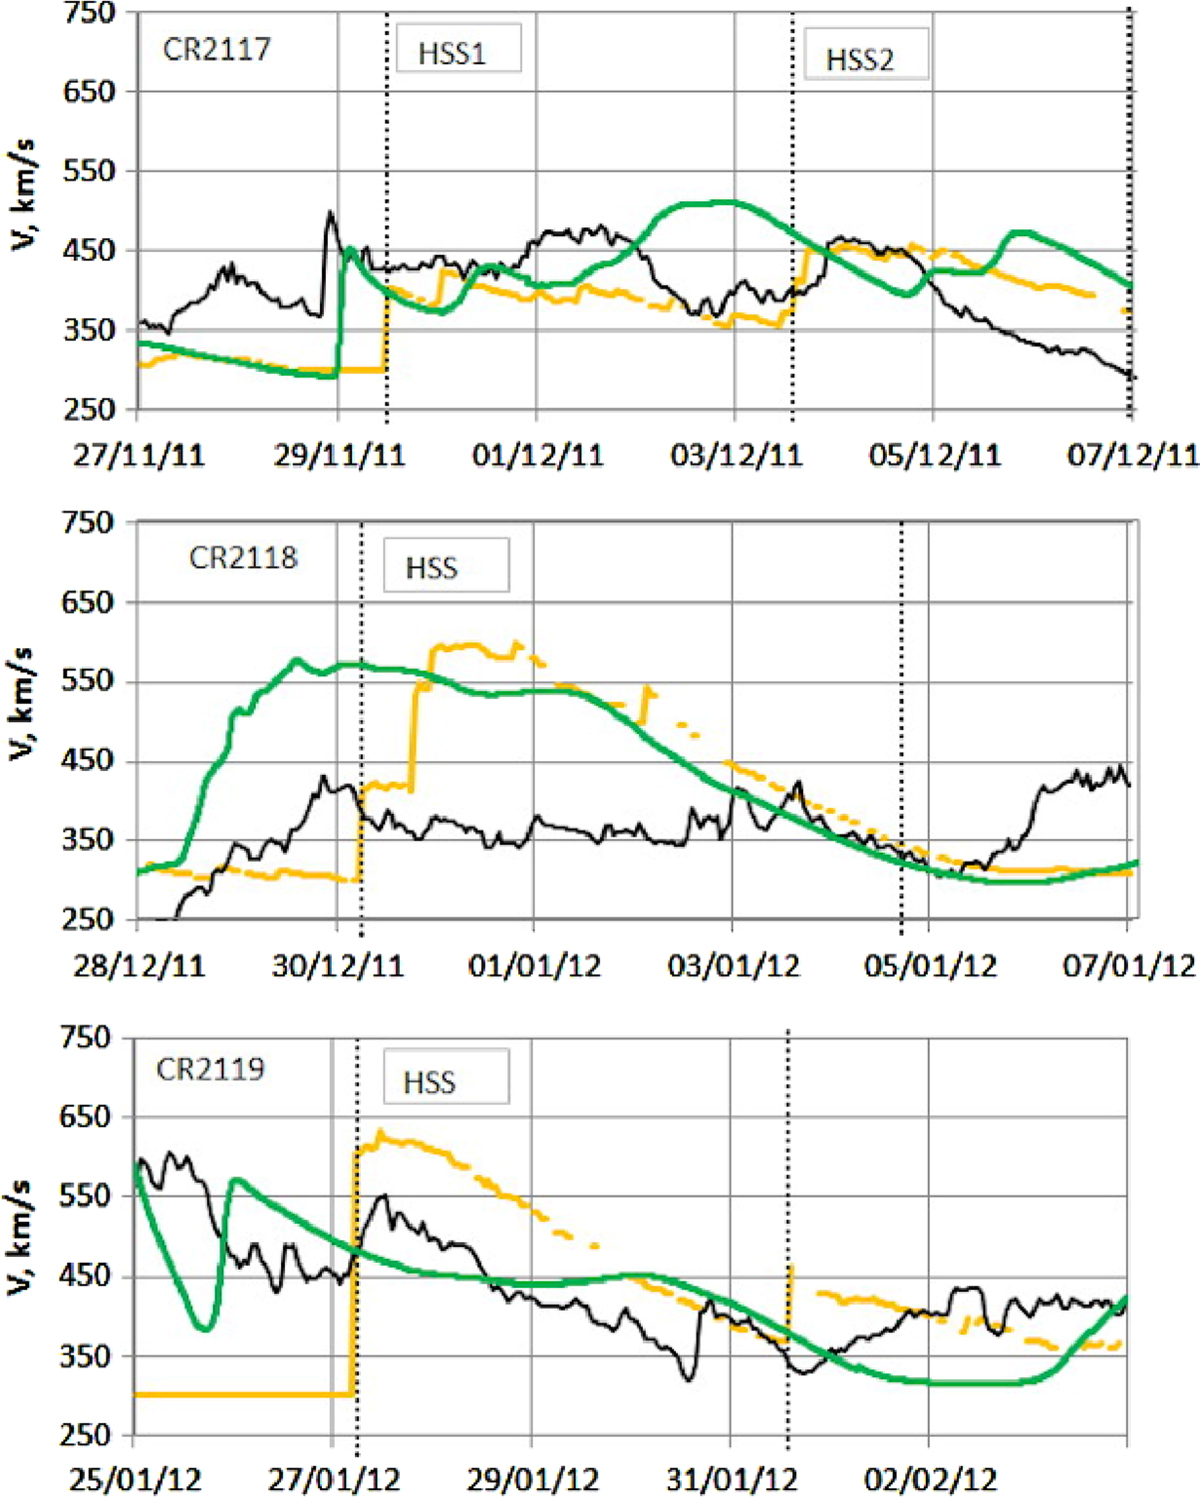
Data presented from top to bottom for CRs 2117–2119. The proton speed measured by ACE (the black curve), the proton speed calculated by the HE model (the yellow curve) and calculated by the WSA-ENLIL Cone model (the green curve).
Current usage metrics show cumulative count of Article Views (full-text article views including HTML views, PDF and ePub downloads, according to the available data) and Abstracts Views on Vision4Press platform.
Data correspond to usage on the plateform after 2015. The current usage metrics is available 48-96 hours after online publication and is updated daily on week days.
Initial download of the metrics may take a while.