Fig. 3
Download original image
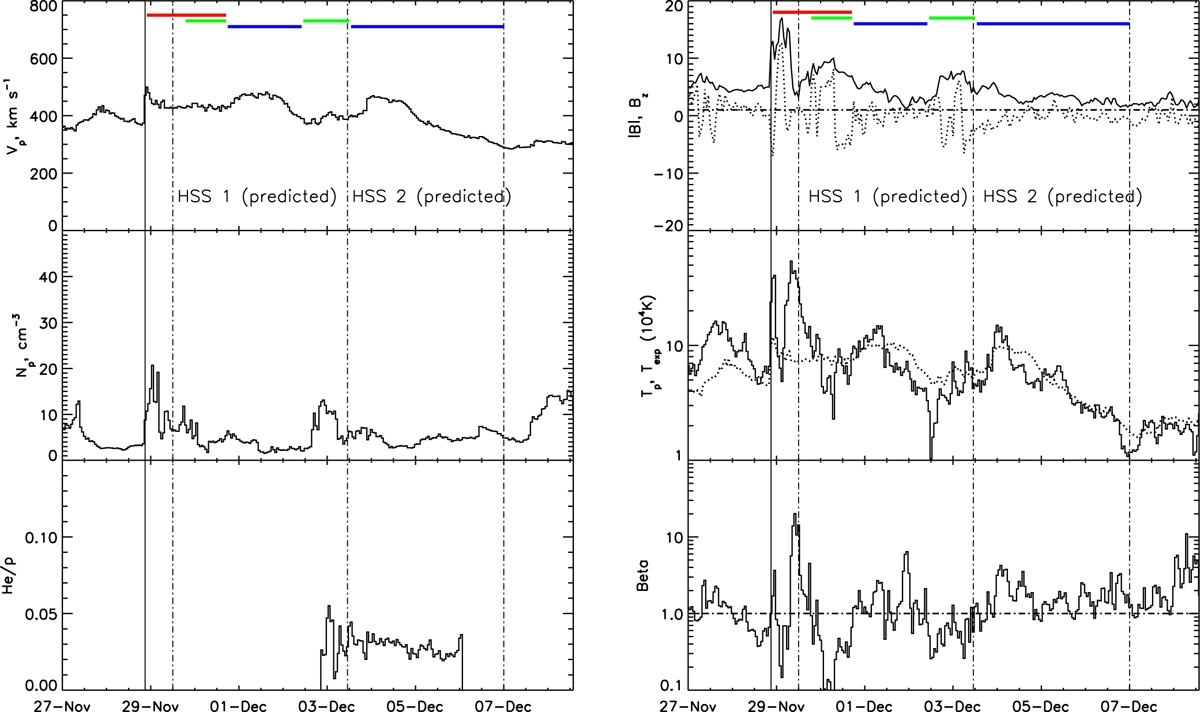
Solar wind parameters for the period 27 November 2011, 00:00 UT–08 December 2012, 12:00 UT (CR 2117). The dash-dotted lines implicate the predicted period of the HSS arrival to the Earth. The dotted lines correspond to: in the proton temperature graph − the expected temperature, in the magnetic field graph − Bz component. The solid vertical line shows a shock. The solar wind phenomena marked by the color bars are: HSSs (blue bar), ICMEs (green bar), CME-HSS interaction regions (red bar).
Current usage metrics show cumulative count of Article Views (full-text article views including HTML views, PDF and ePub downloads, according to the available data) and Abstracts Views on Vision4Press platform.
Data correspond to usage on the plateform after 2015. The current usage metrics is available 48-96 hours after online publication and is updated daily on week days.
Initial download of the metrics may take a while.