Fig. 1
Download original image
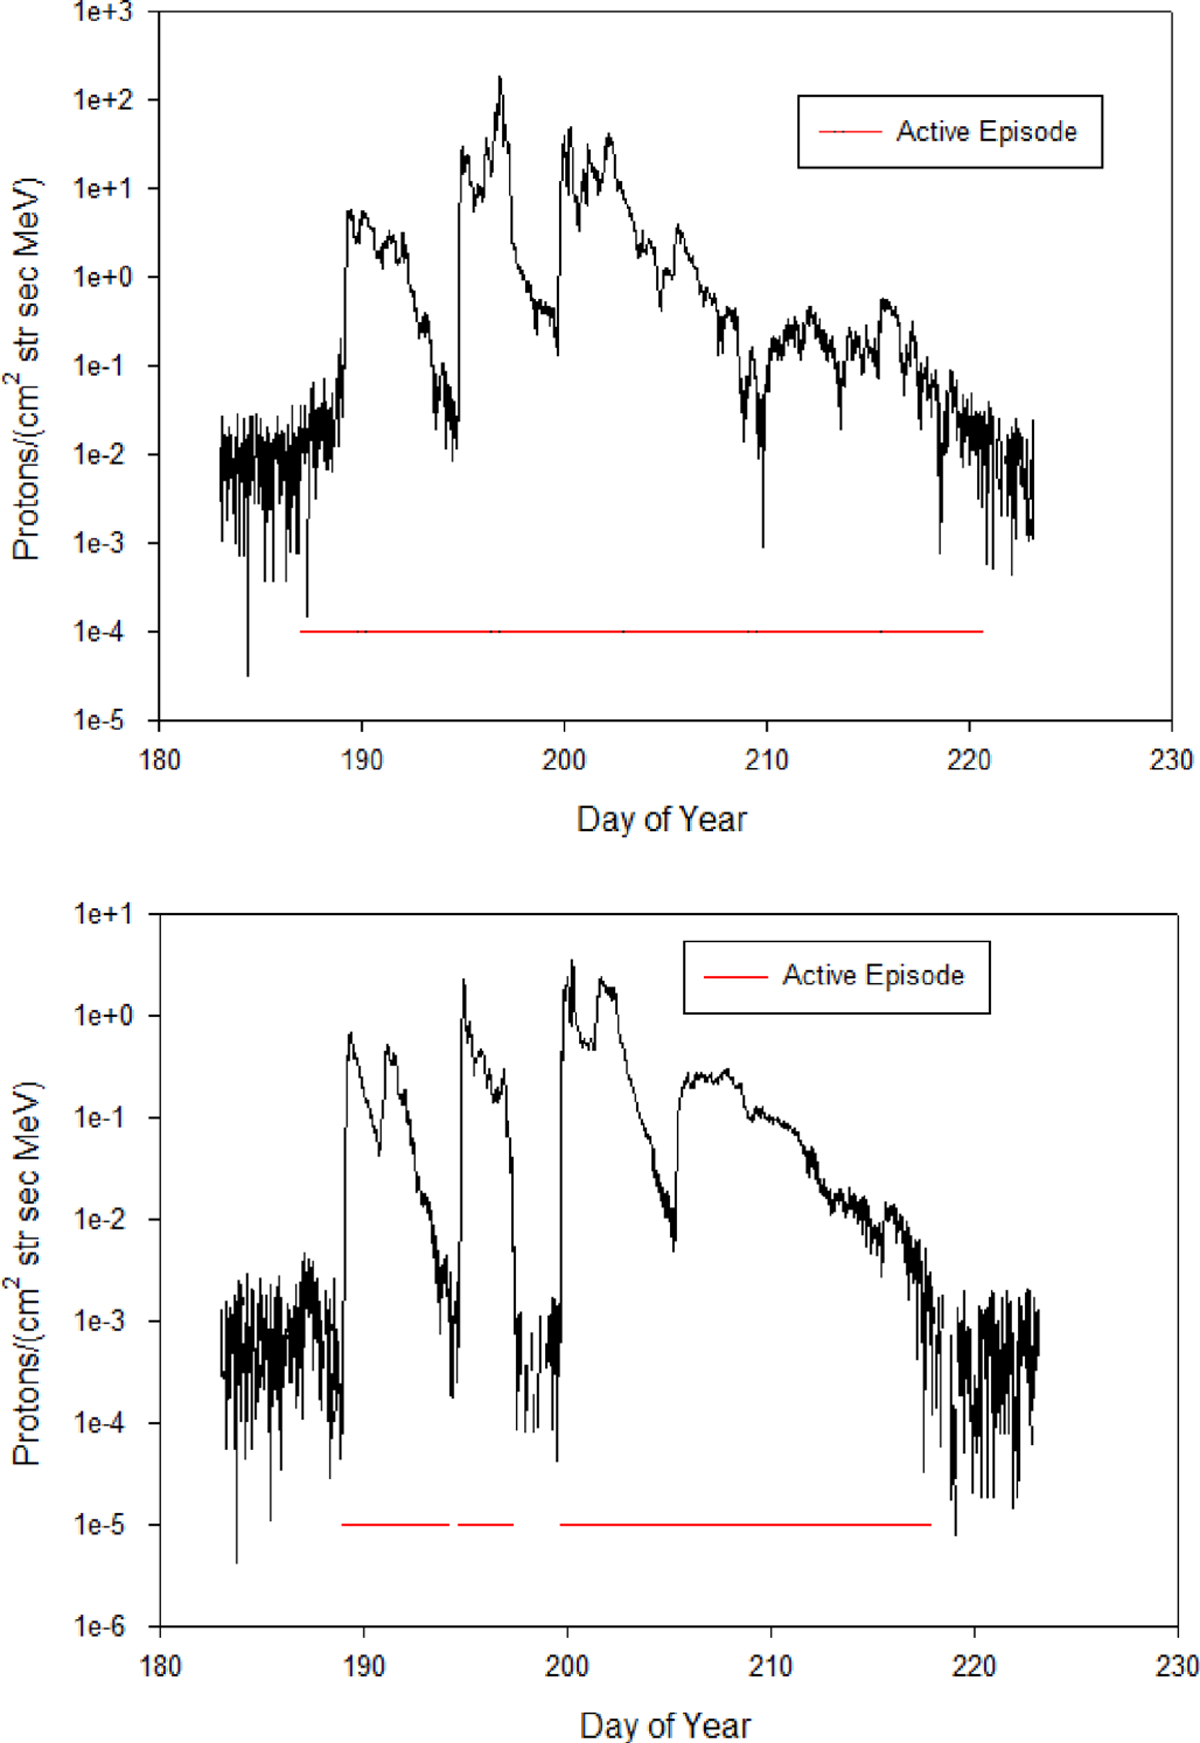
The proton flux in two different channels were plotted for the July 4, 2012 episode. The red line in both graphs represents the times during which the episode is above background in each channel. Top panel: The proton flux for channel P2 is shown. Bottom panel: The proton flux for channel P4 is shown. The flux returned to background on day 194 and between the days 197–199 in channel P4.
Current usage metrics show cumulative count of Article Views (full-text article views including HTML views, PDF and ePub downloads, according to the available data) and Abstracts Views on Vision4Press platform.
Data correspond to usage on the plateform after 2015. The current usage metrics is available 48-96 hours after online publication and is updated daily on week days.
Initial download of the metrics may take a while.