Fig. 2
Download original image
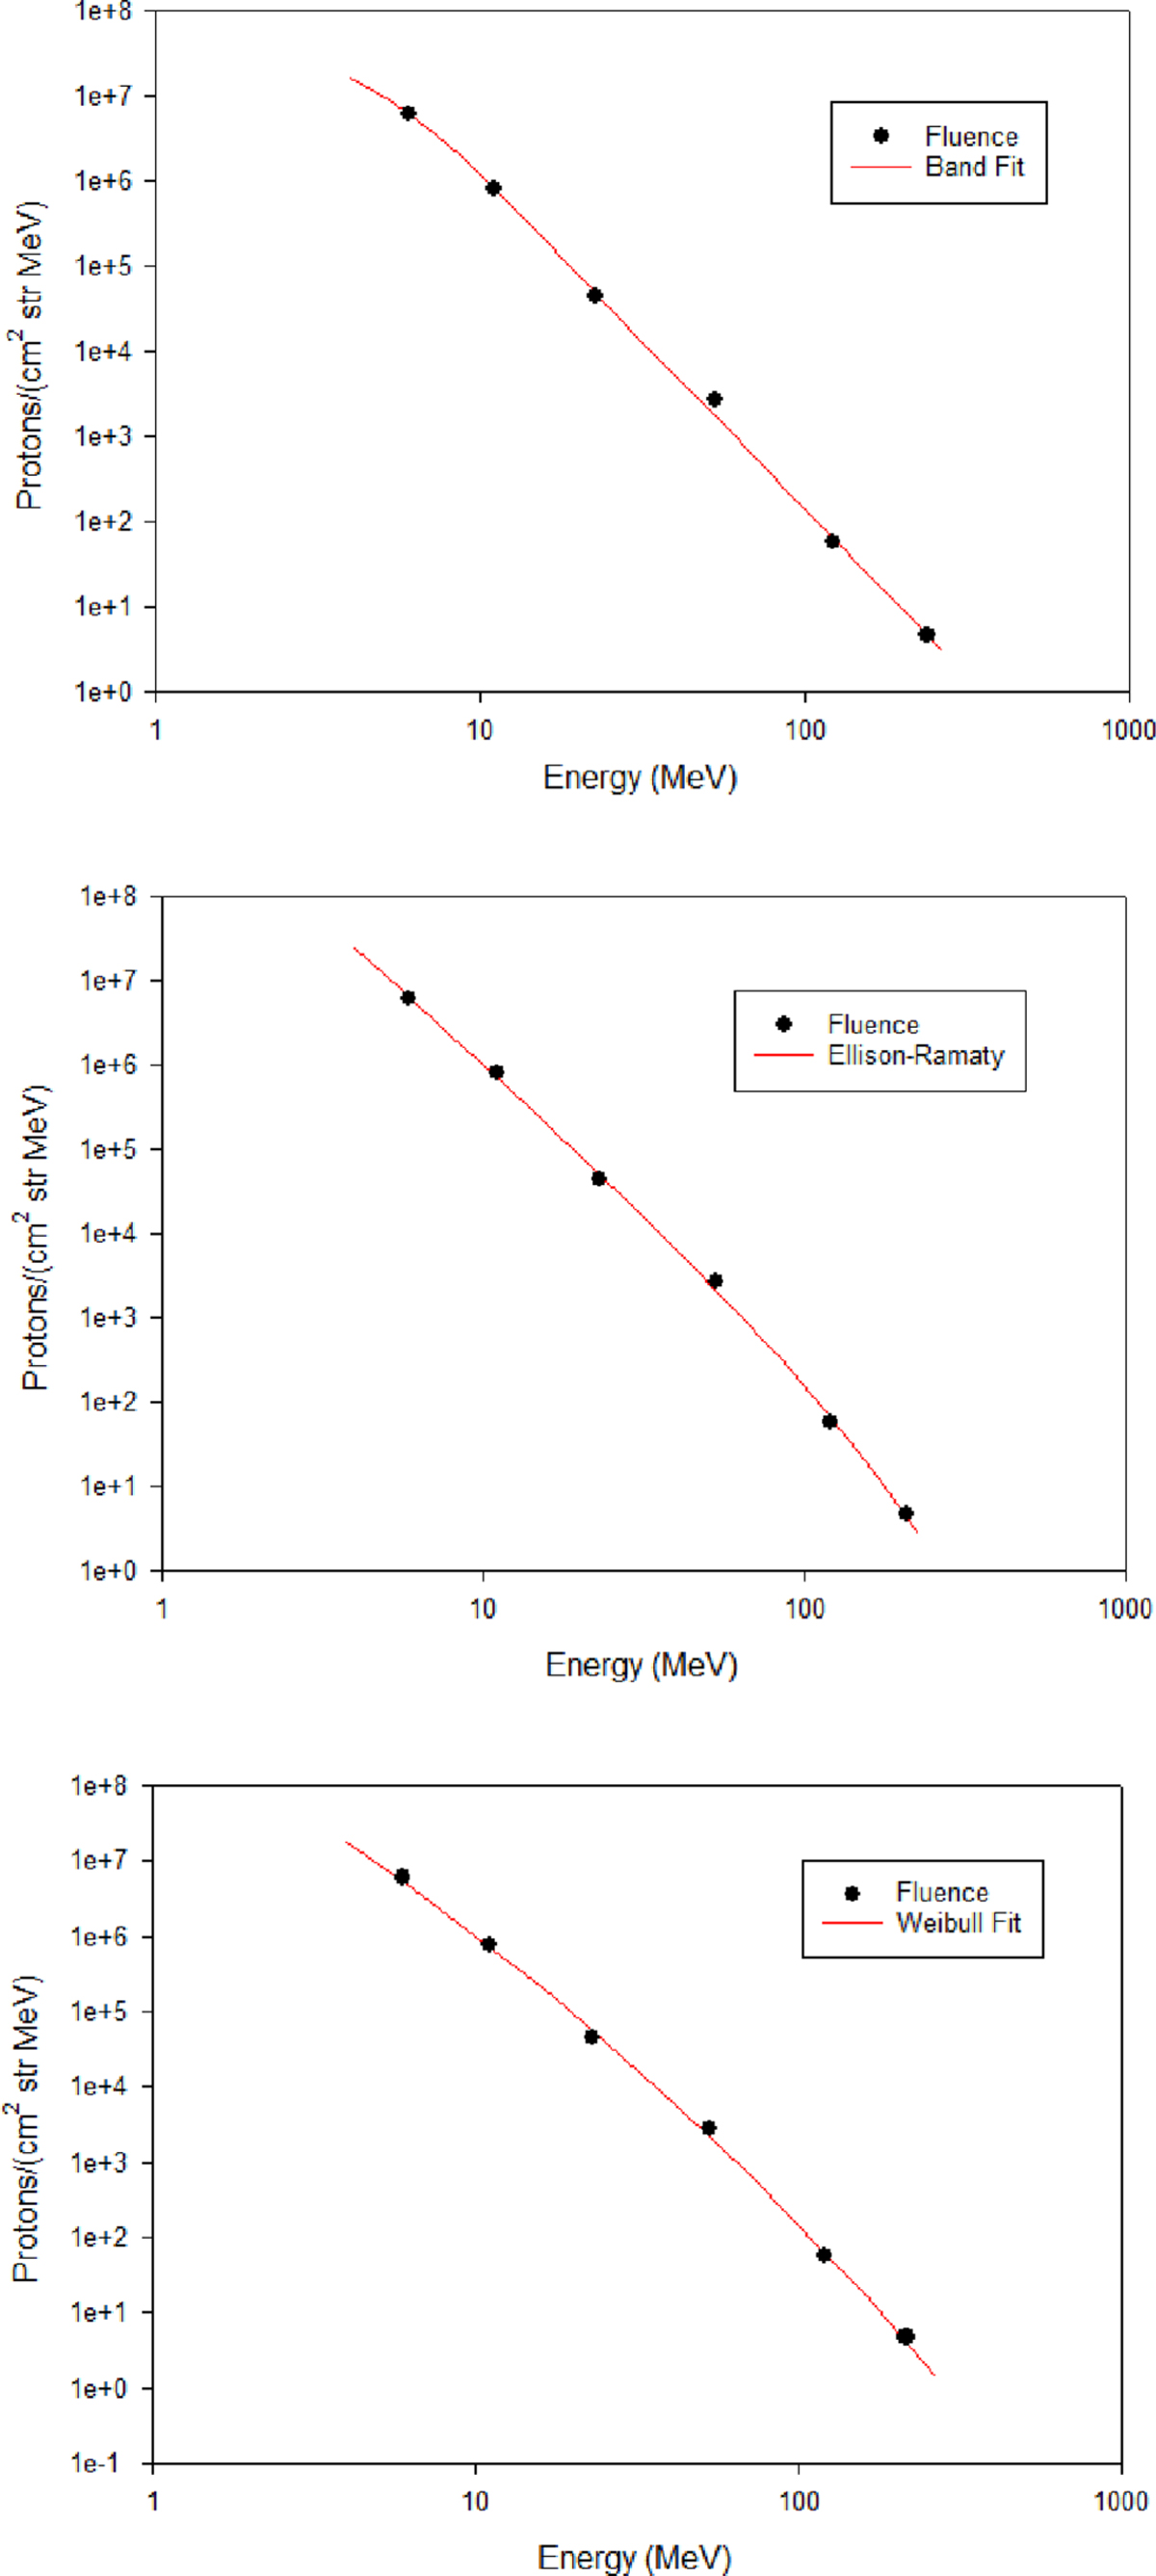
This figure shows the spectra fitting process of the Band, Weibull, and Ellison-Ramaty functions for the April 18, 2014 episode. The top panel shows the Band Function fit, which had a χ2 value of 2.02. The middle panel uses the Ellison-Ramaty model to fit the episode and the fit had a χ2 value of 0.9839. The bottom panel shows the Weibull function and had a χ2 value of 1.214. The Ellison-Ramaty model was chosen to fit this episode.
Current usage metrics show cumulative count of Article Views (full-text article views including HTML views, PDF and ePub downloads, according to the available data) and Abstracts Views on Vision4Press platform.
Data correspond to usage on the plateform after 2015. The current usage metrics is available 48-96 hours after online publication and is updated daily on week days.
Initial download of the metrics may take a while.