Fig. 8
Download original image
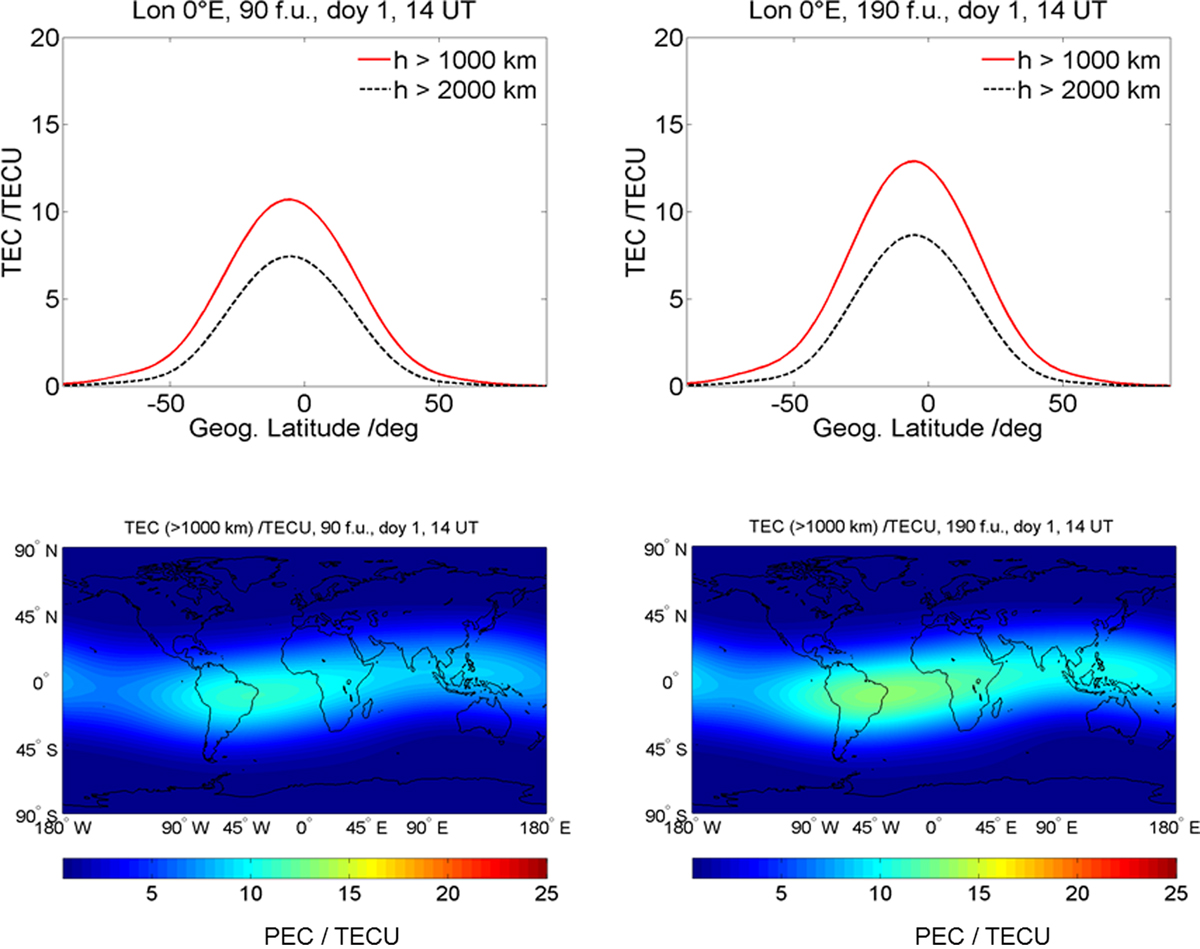
Upper panel: Vertical TEC of the plasmasphere from 1000 km (red line) and 2000 km (black dotted line) upward as a function of geographic latitudes along the geographic longitude λ = 0° E for low and high solar activity conditions. Lower panel: Global maps of PEC at 14:00 UT under low (F10.7 = 90) and high solar activity conditions (F10.7 = 190).
Current usage metrics show cumulative count of Article Views (full-text article views including HTML views, PDF and ePub downloads, according to the available data) and Abstracts Views on Vision4Press platform.
Data correspond to usage on the plateform after 2015. The current usage metrics is available 48-96 hours after online publication and is updated daily on week days.
Initial download of the metrics may take a while.