Fig. 1
Download original image
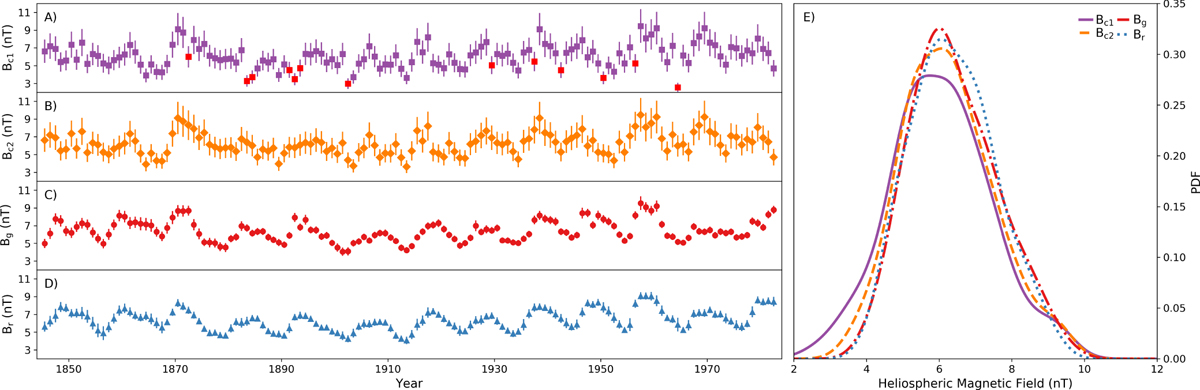
(A–D) Time series of the annual HMF reconstructions from 1845–1983, derived from; 10Be concentrations, Bc1 (with impulsive enhancements), and Bc2 (with suppressed impulsive enhancements); geomagnetic observations, Bg; and sunspot observations, Br. Error bars are 1σ errors of the mean. The red squares in panel (A) mark years where Bc1 ≠ Bc2. (E) Kernel density estimates of the distributions of four different HMF reconstructions.
Current usage metrics show cumulative count of Article Views (full-text article views including HTML views, PDF and ePub downloads, according to the available data) and Abstracts Views on Vision4Press platform.
Data correspond to usage on the plateform after 2015. The current usage metrics is available 48-96 hours after online publication and is updated daily on week days.
Initial download of the metrics may take a while.