Fig. 3
Download original image
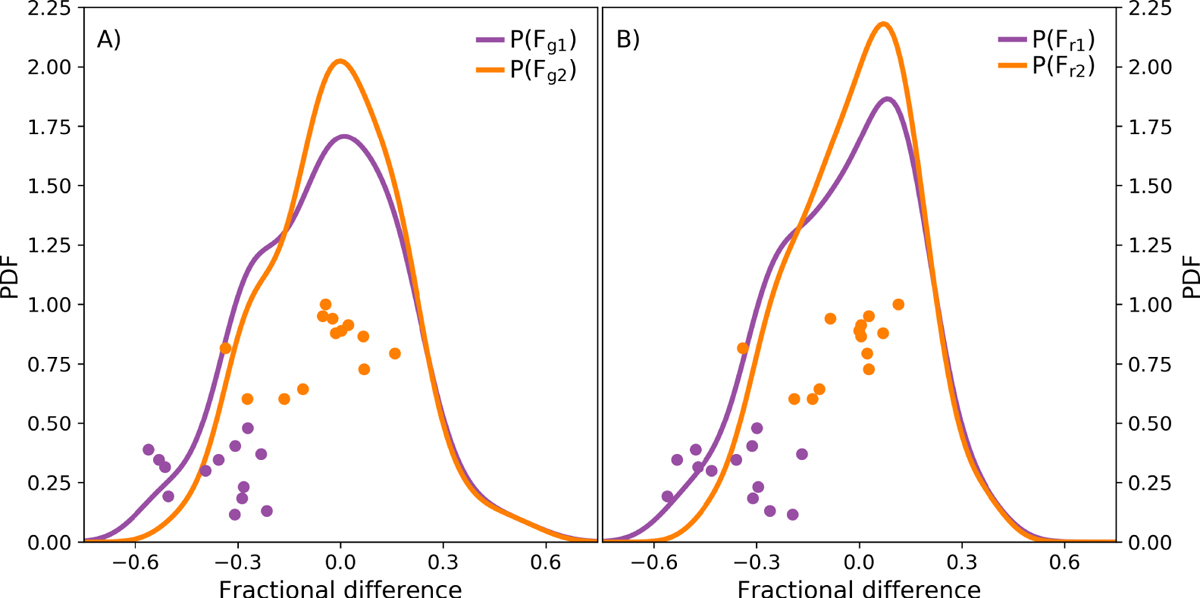
(A) Kernel density estimates of the distributions of fractional differences between Bg with Bc1 and Bc2, Fg1 and Fg2, respectively. The purple and orange dots show the fractional differences in years (McCracken & Beer, 2015) identified as being affected by SEP events (the vertical coordinates of these points is randomised, which otherwise overlap). (B) The same as panel (A), except showing the fractional differences of Br with Bc1 and Bc2.
Current usage metrics show cumulative count of Article Views (full-text article views including HTML views, PDF and ePub downloads, according to the available data) and Abstracts Views on Vision4Press platform.
Data correspond to usage on the plateform after 2015. The current usage metrics is available 48-96 hours after online publication and is updated daily on week days.
Initial download of the metrics may take a while.