Fig. 6
Download original image
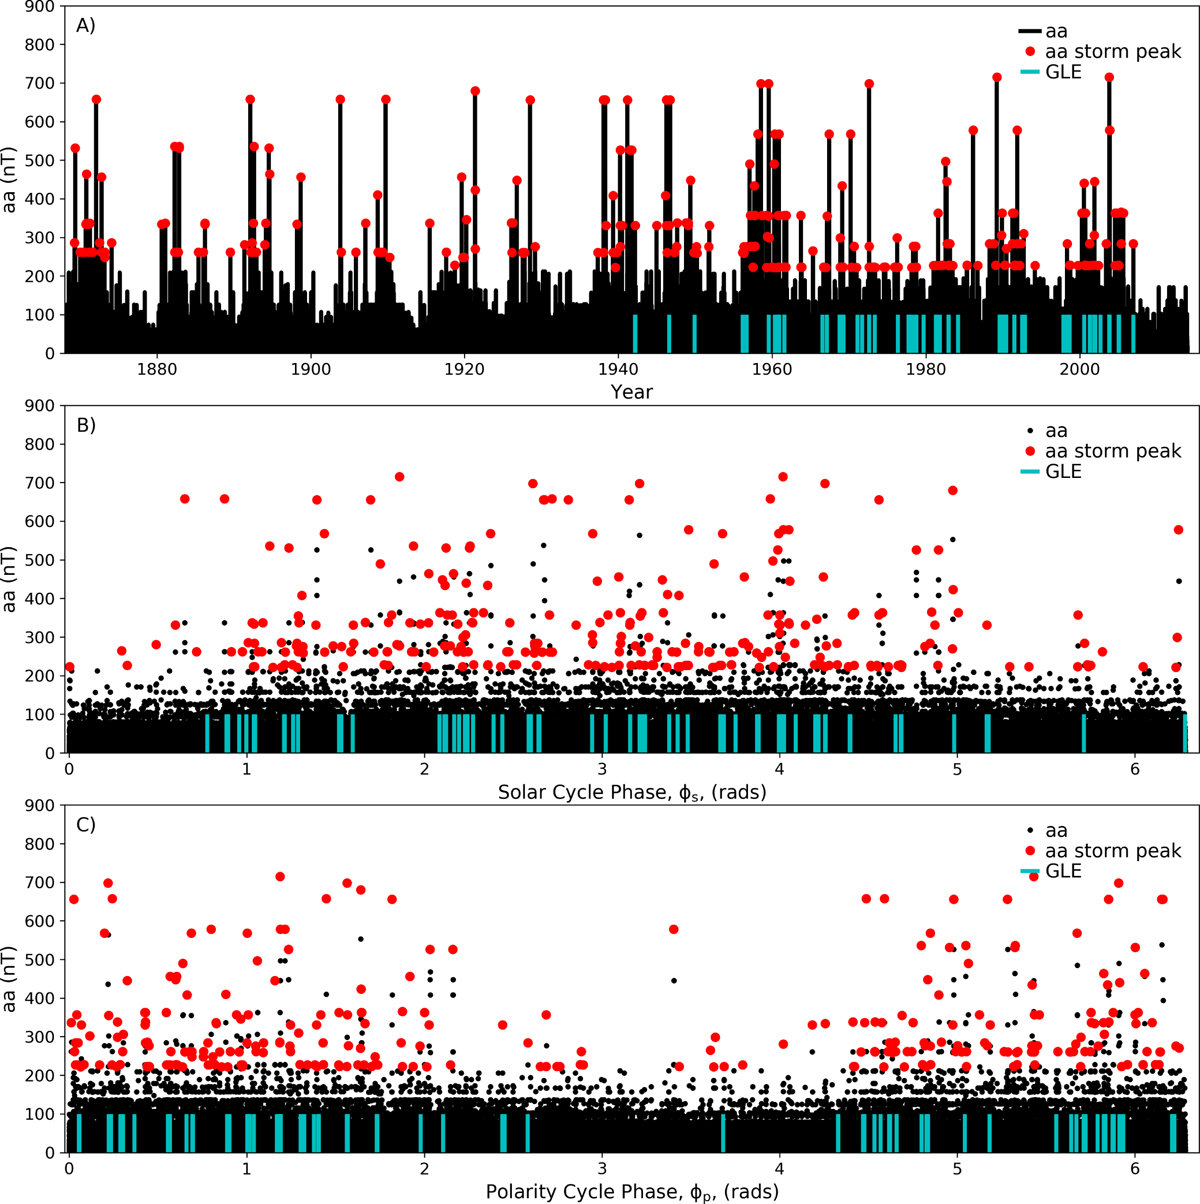
(A) Time series of the aa geomagnetic index (black), from 1867–2014, with the maxima of great geomagnetic storms marked by red circles. Also shown are the timings of known GLE events (cyan lines). Panel (B) Shows the same data as (A), except as a function of Schwabe cycle phase. Panel (C) Shows the same data as (A), except as a function of polarity cycle phase. We note that, due to the availability of 10Be data, we only use the geomagnetic and GLE observations up until 1983.
Current usage metrics show cumulative count of Article Views (full-text article views including HTML views, PDF and ePub downloads, according to the available data) and Abstracts Views on Vision4Press platform.
Data correspond to usage on the plateform after 2015. The current usage metrics is available 48-96 hours after online publication and is updated daily on week days.
Initial download of the metrics may take a while.