Fig. 7
Download original image
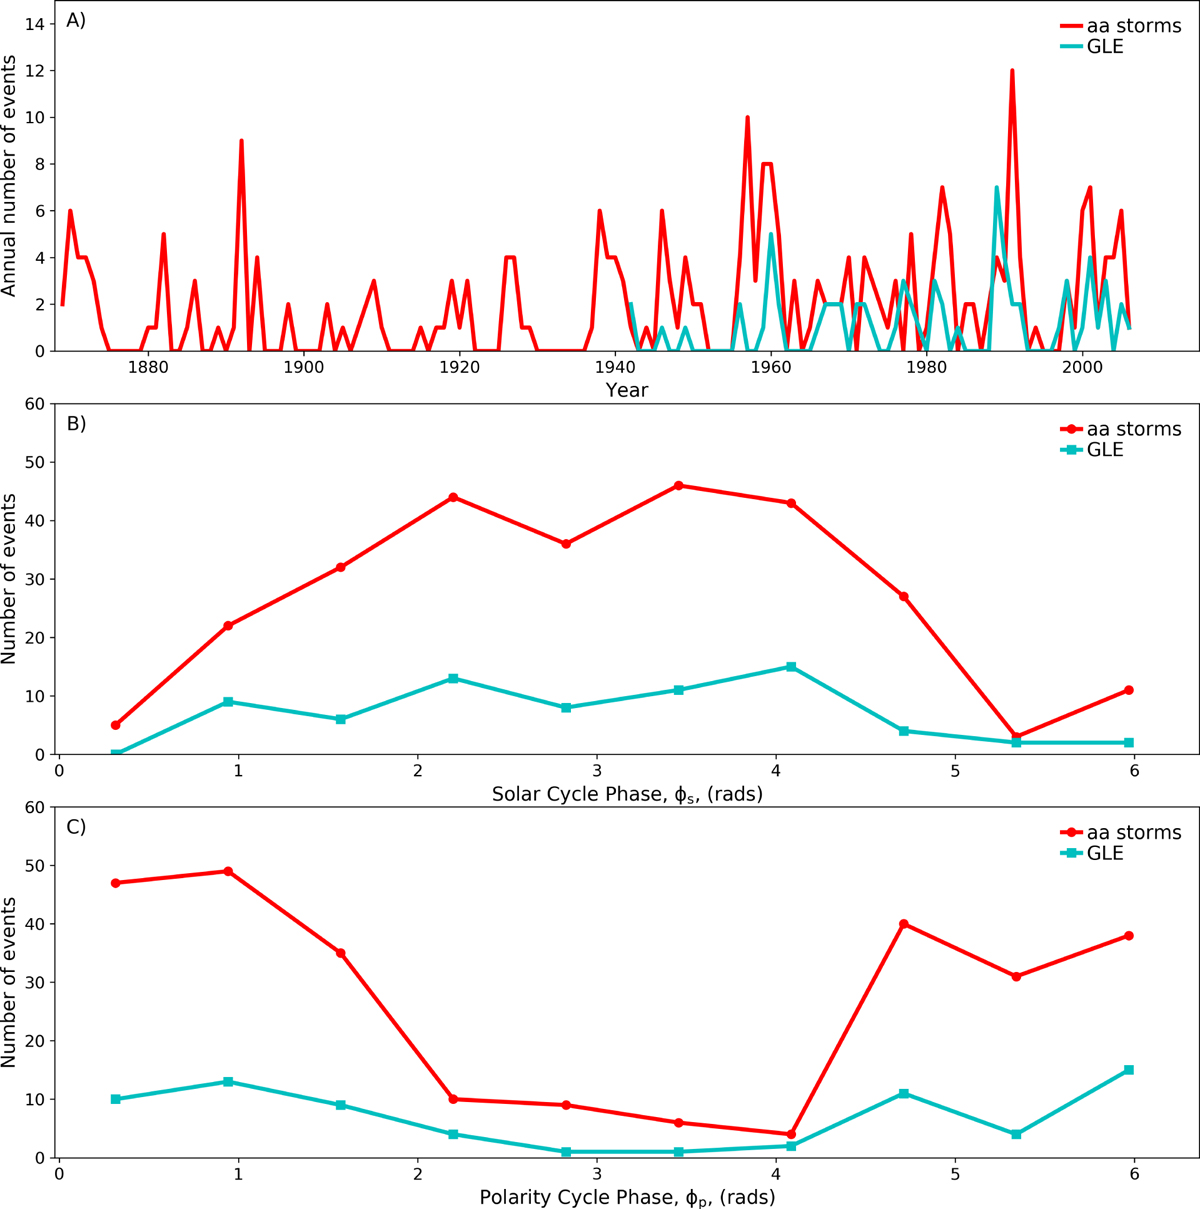
(A) Time series of the annual count of great geomagnetic storms (red), and GLE events (cyan). (B) The number of great geomagnetic storms (red) and GLE events (cyan) as a function of Schwabe cycle phase. (C) The number of geomagnetic storms (red) and GLE events (cyan) as a function of polarity cycle phase. In panels (B) and (C), phase bins 2π/10 wide were used. No account was taken of the uneven sampling of solar cycle phase, or the fact the GLE record only spans 1937-present; these plots only show coarse trends with solar/polarity cycle phase, and the absolute number of geomagnetic storms and GLE events should not be directly compared. We note that, due to the availability of 10Be data, we only use the geomagnetic and GLE observations up until 1983.
Current usage metrics show cumulative count of Article Views (full-text article views including HTML views, PDF and ePub downloads, according to the available data) and Abstracts Views on Vision4Press platform.
Data correspond to usage on the plateform after 2015. The current usage metrics is available 48-96 hours after online publication and is updated daily on week days.
Initial download of the metrics may take a while.