Fig. 8
Download original image
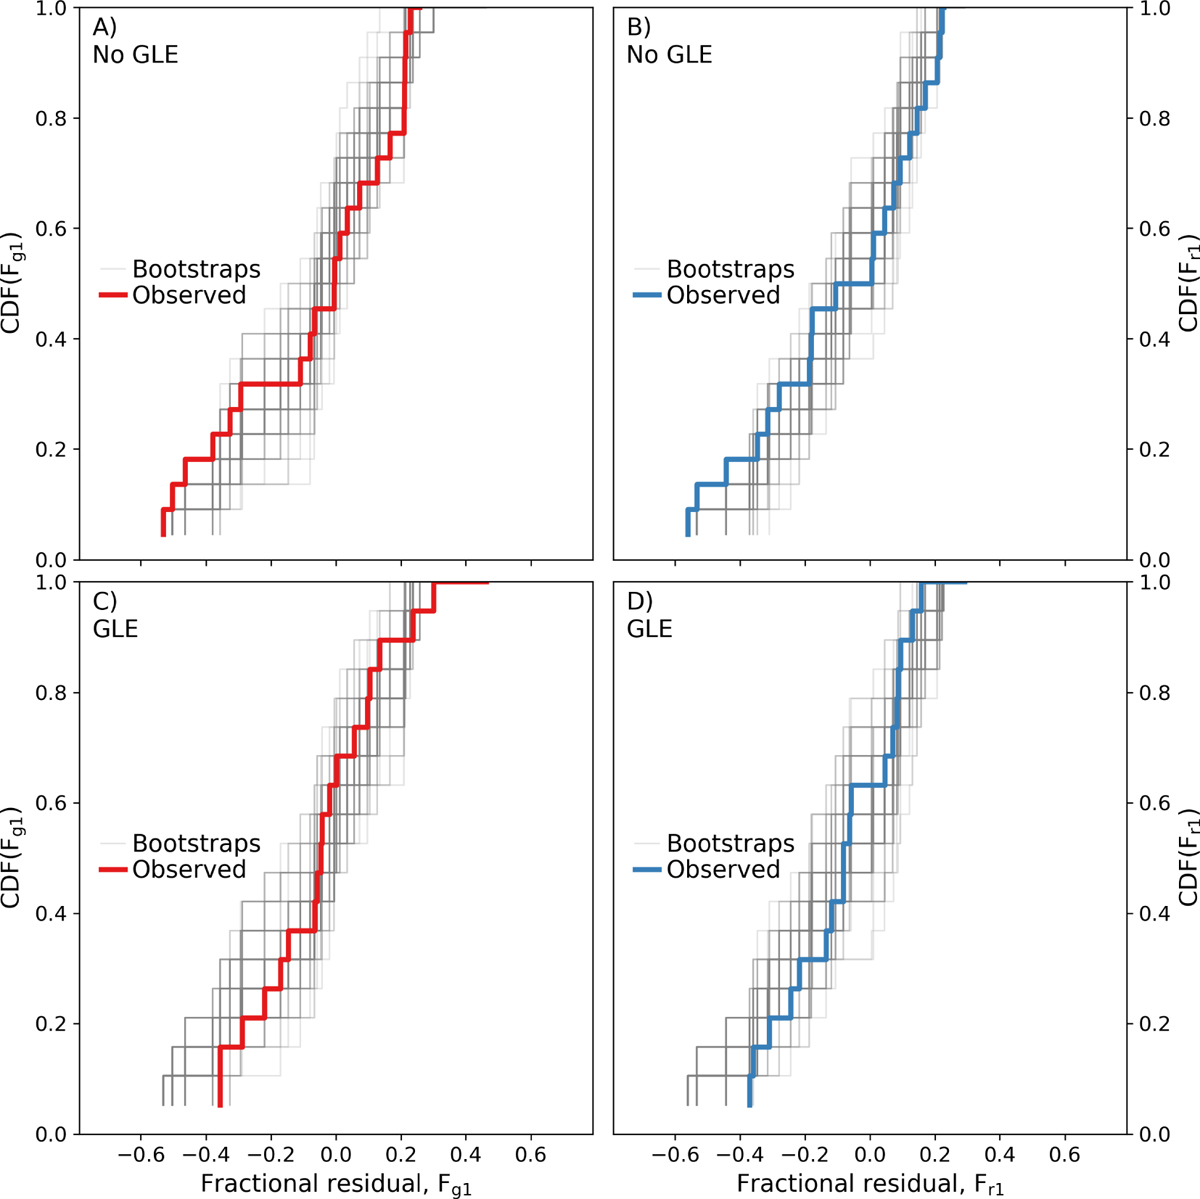
(A) The ECDF of Fg1 is given in red, computed for only the 22 years without GLE events. The grey lines show 100 bootstrap estimates of the Fg1 ECDF, computed by randomly sampling 22 years from the Fg1 series. Panel B has the same structure as panel A, but instead shows the ECDF of Fr1 in blue. Panels (C) and (D) have the same structure as (A) and (B), but instead show the ECDFs of Fg1 and Fr1 from only those 19 years with GLE events.
Current usage metrics show cumulative count of Article Views (full-text article views including HTML views, PDF and ePub downloads, according to the available data) and Abstracts Views on Vision4Press platform.
Data correspond to usage on the plateform after 2015. The current usage metrics is available 48-96 hours after online publication and is updated daily on week days.
Initial download of the metrics may take a while.