Open Access
Fig. 1.
Download original image
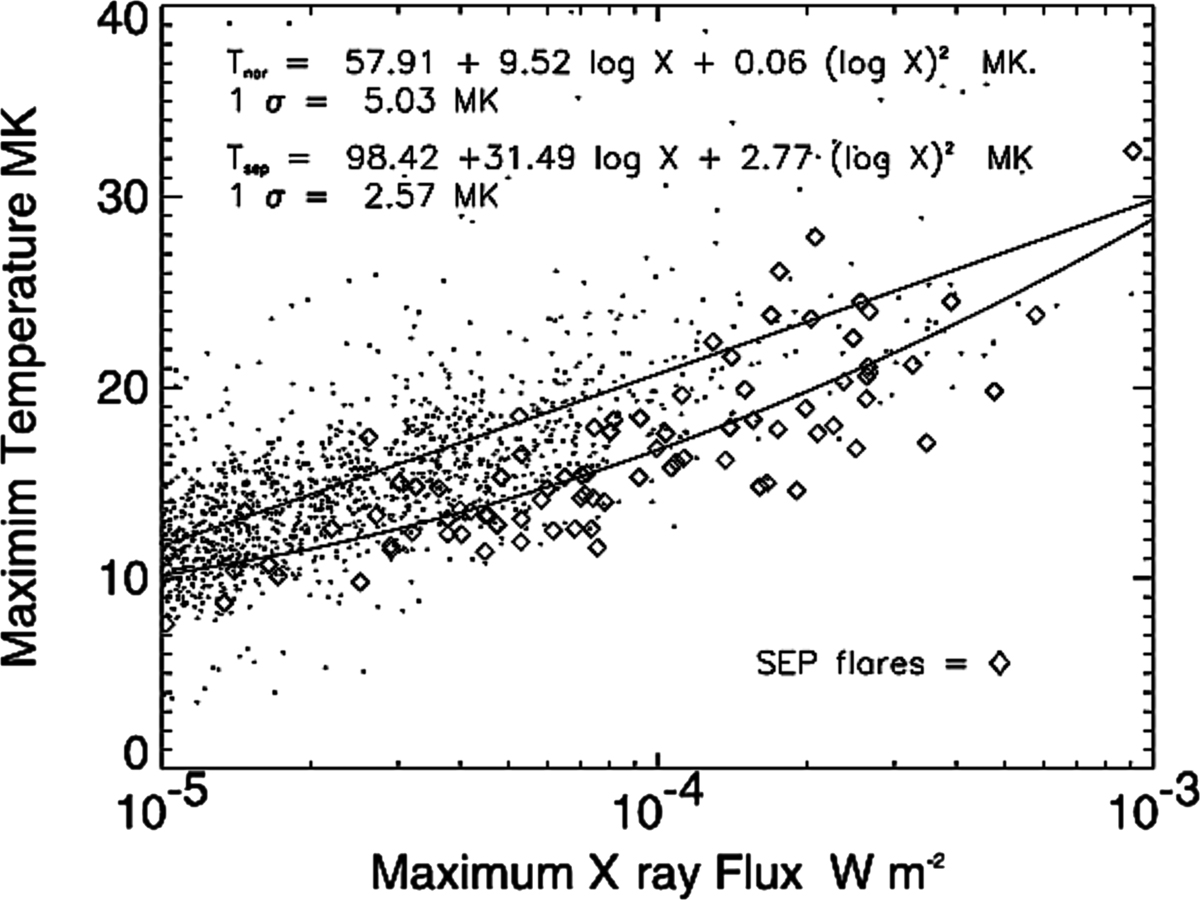
Maximum X-ray flare temperatures versus maximum 0.1–0.8 nm flare fluxes for the period 1988–2002. NOAA SEP events are indicated with diamonds (from Garcia, 2004a).
Current usage metrics show cumulative count of Article Views (full-text article views including HTML views, PDF and ePub downloads, according to the available data) and Abstracts Views on Vision4Press platform.
Data correspond to usage on the plateform after 2015. The current usage metrics is available 48-96 hours after online publication and is updated daily on week days.
Initial download of the metrics may take a while.