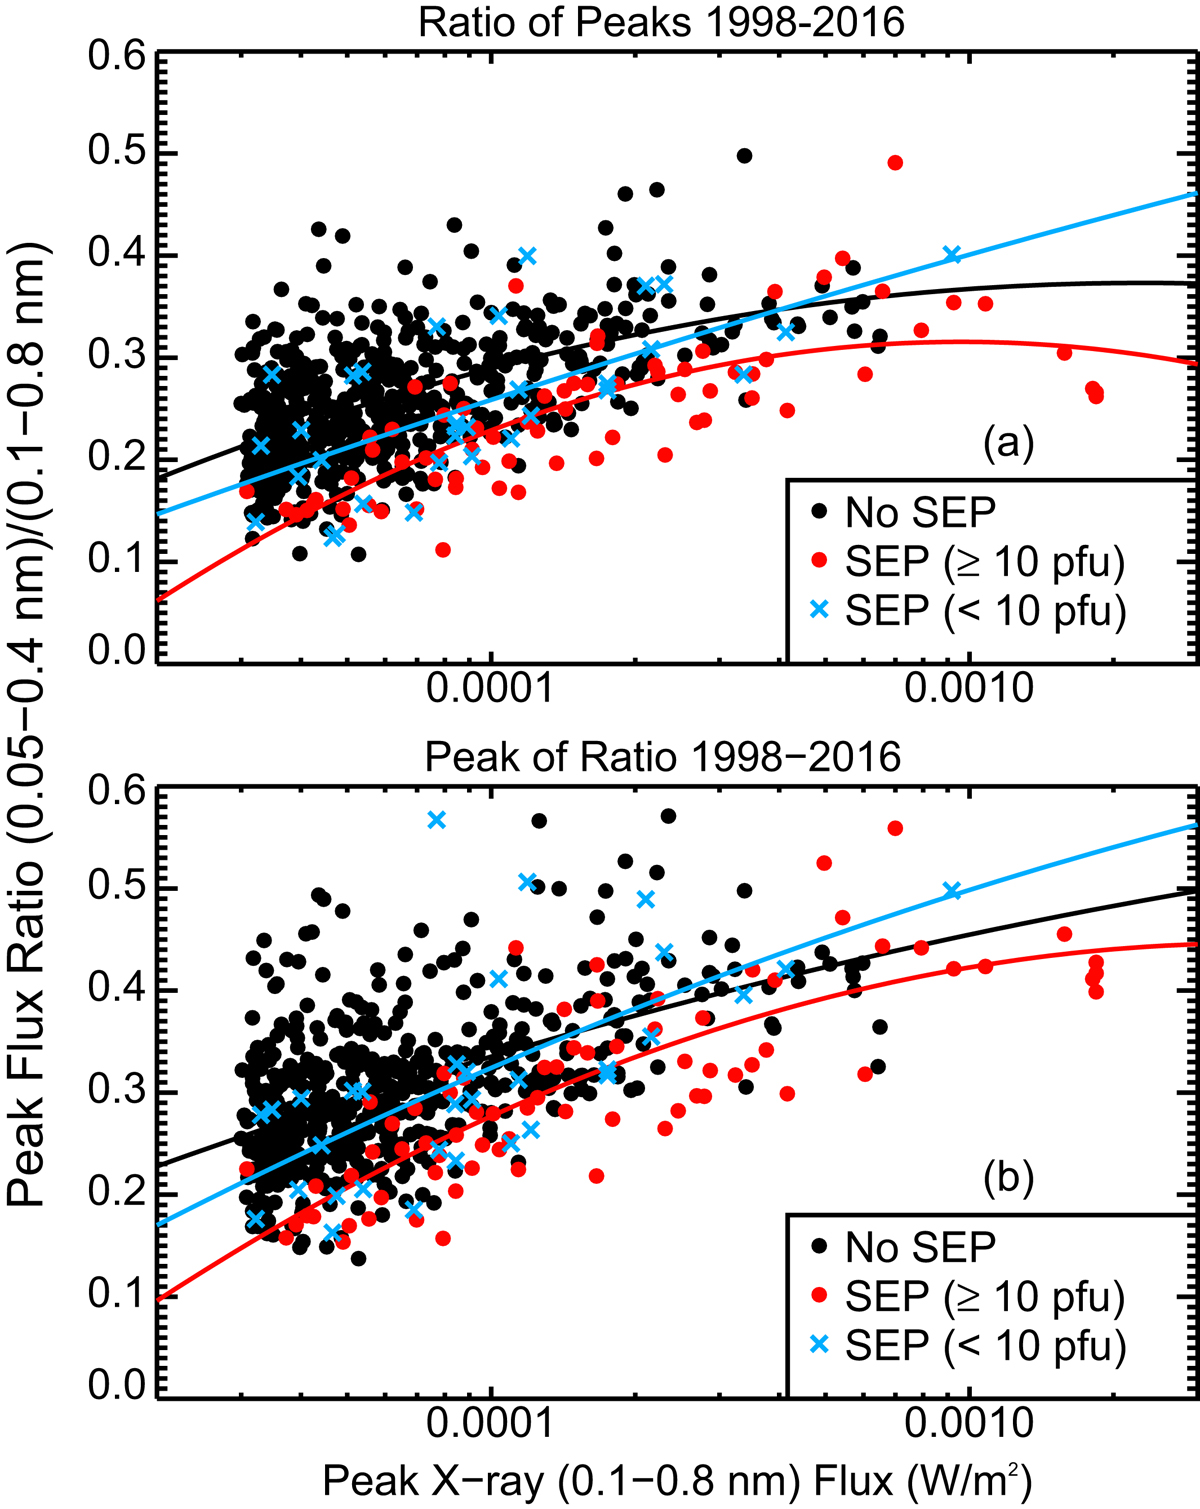
Fig. 2.
Download original image
(a) Ratios of the 0.05–0.4 nm and 0.1–0.8 nm peak fluxes versus peak 0.1–0.8 nm flare fluxes for No-SEP, NOAA, and small SEP events. (b) Peaks of the flux ratios, corresponding to maximum temperatures, versus peak 0.1–0.8 nm flare fluxes for the same SEP event classes. The peaks of flux ratios in this plot are adopted for subsequent analysis. Quadratic fits to each group are shown.
Current usage metrics show cumulative count of Article Views (full-text article views including HTML views, PDF and ePub downloads, according to the available data) and Abstracts Views on Vision4Press platform.
Data correspond to usage on the plateform after 2015. The current usage metrics is available 48-96 hours after online publication and is updated daily on week days.
Initial download of the metrics may take a while.