Open Access
Fig. 5.
Download original image
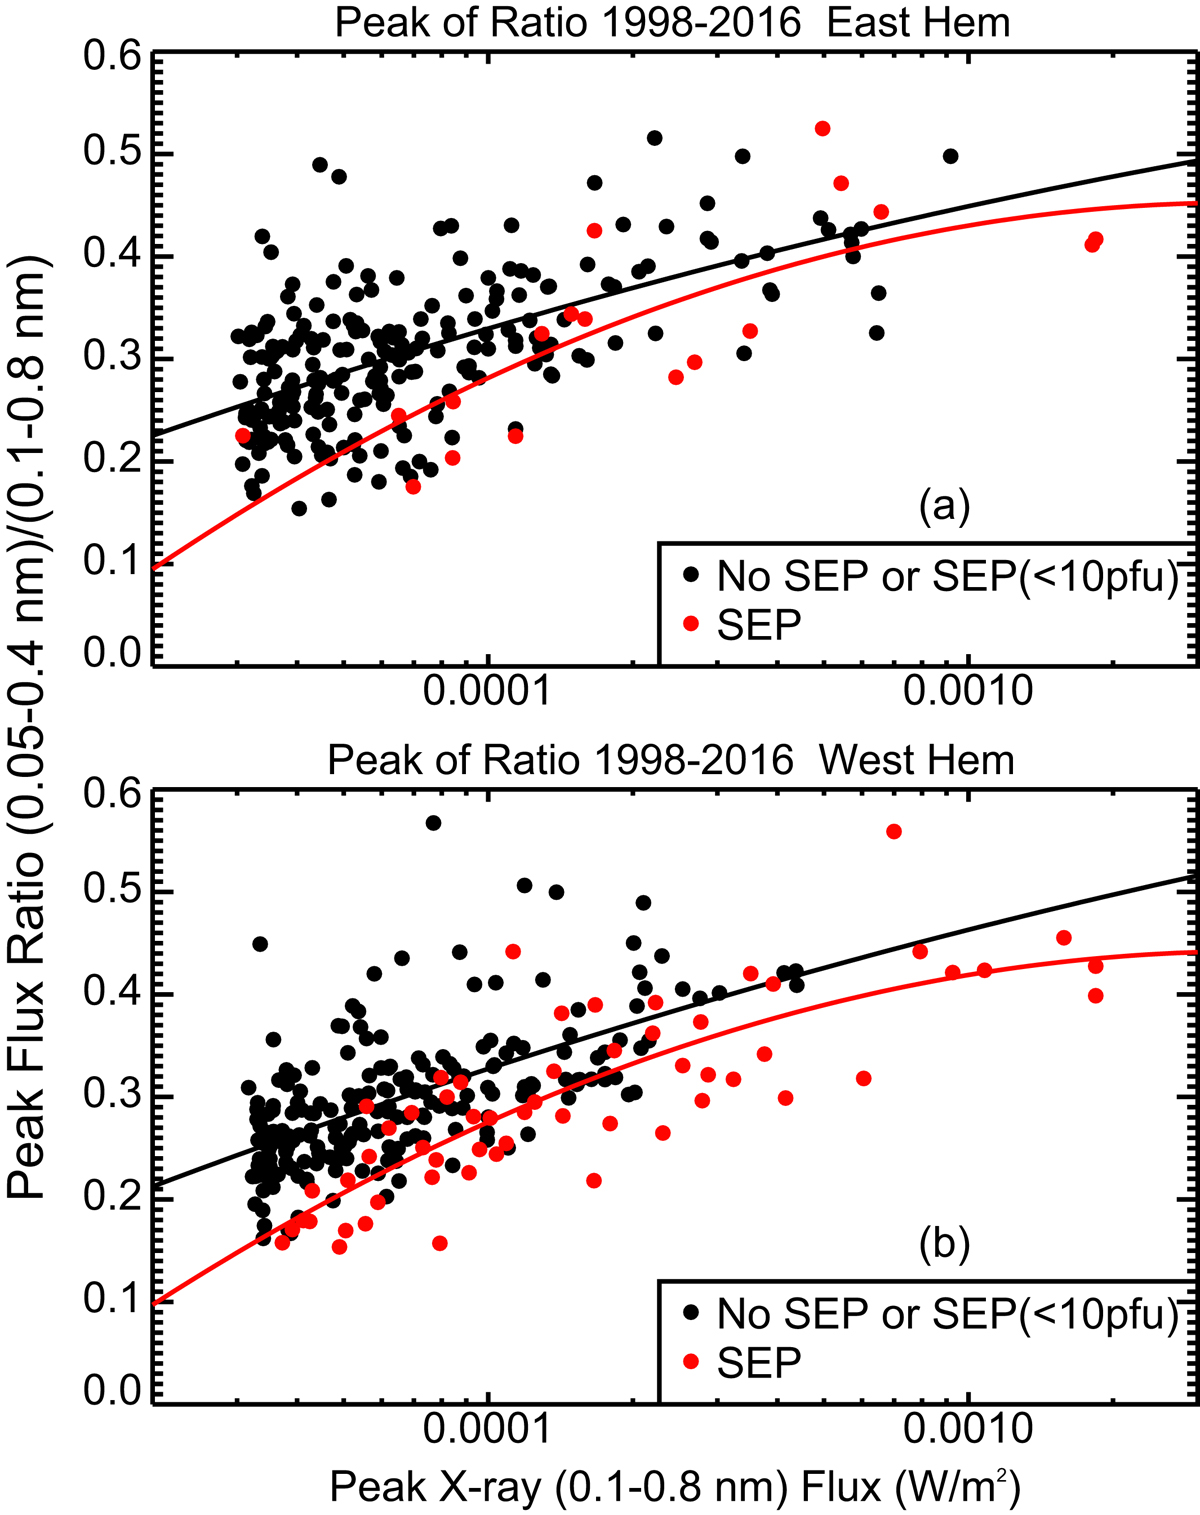
(a) Peak flux ratios versus 0.1–0.8 nm peak fluxes for NOAA SEP events in the eastern hemisphere. Solid lines are polynomial quadratic best fits. (b) Same for the western hemisphere.
Current usage metrics show cumulative count of Article Views (full-text article views including HTML views, PDF and ePub downloads, according to the available data) and Abstracts Views on Vision4Press platform.
Data correspond to usage on the plateform after 2015. The current usage metrics is available 48-96 hours after online publication and is updated daily on week days.
Initial download of the metrics may take a while.