Open Access
Fig. 2
Download original image
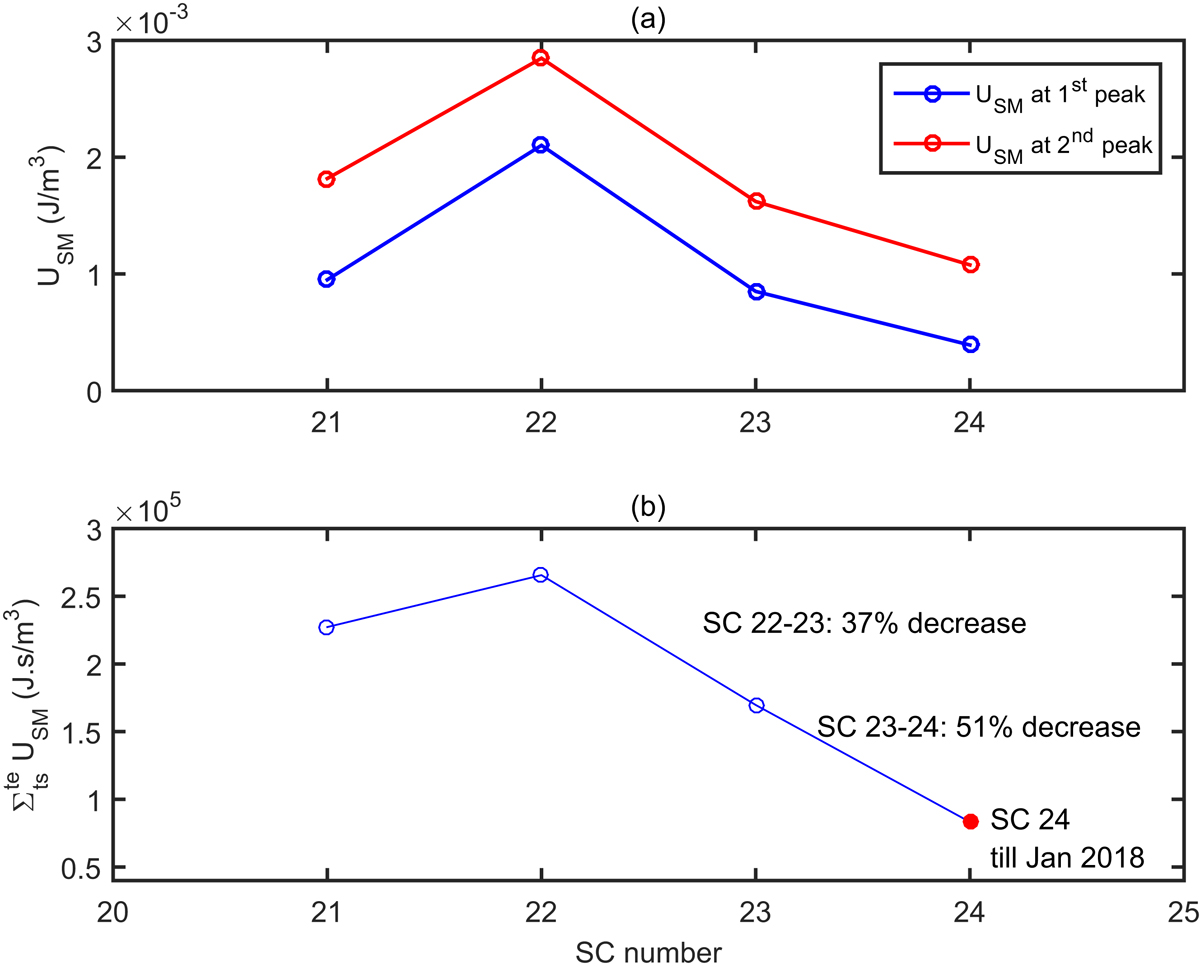
(a) Variation of magnitude of 1st and 2nd peak in the SMED for SCs 21–24, (b) the integrated solar magnetic energy for SCs 21–24. The value ![]() for SC 24 (shown by red solid circle) represents the integrated energy density till January 2018.
for SC 24 (shown by red solid circle) represents the integrated energy density till January 2018.
Current usage metrics show cumulative count of Article Views (full-text article views including HTML views, PDF and ePub downloads, according to the available data) and Abstracts Views on Vision4Press platform.
Data correspond to usage on the plateform after 2015. The current usage metrics is available 48-96 hours after online publication and is updated daily on week days.
Initial download of the metrics may take a while.