Fig. 5
Download original image
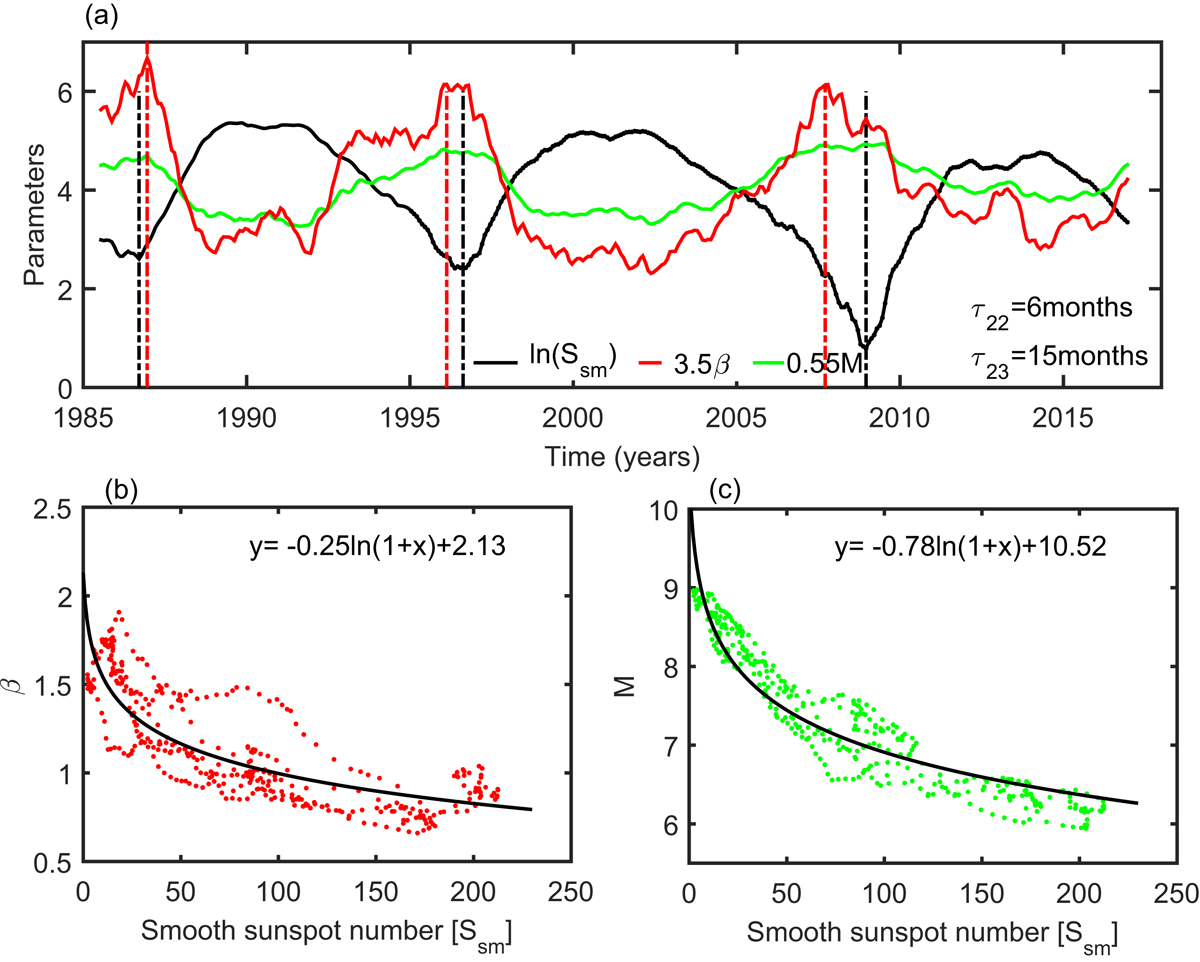
(a) Comparison of monthly smooth sunspot number (black), SWP beta at the bow-shock nose (red) and solar wind magnetosonic Mach number (green). Maximum in solar plasma beta is seen few months (τ = 5–15 months) before the occurrence of the solar minimum in smooth sunspot numbers. The vertical red (black) dashed lines indicate the peak in SWP beta (minimum in SSN), (b) The solar plasma beta as a function of monthly SSN for SCs 22, 23 and 24. (c) The solar wind magnetosonic Mach number as a function of monthly smooth sunspot number for SCs 22, 23, and 24. The black solid curves indicate the logarithmic fit for these variations and their equations are mentioned in respective subplots.
Current usage metrics show cumulative count of Article Views (full-text article views including HTML views, PDF and ePub downloads, according to the available data) and Abstracts Views on Vision4Press platform.
Data correspond to usage on the plateform after 2015. The current usage metrics is available 48-96 hours after online publication and is updated daily on week days.
Initial download of the metrics may take a while.