Fig. 5
Download original image
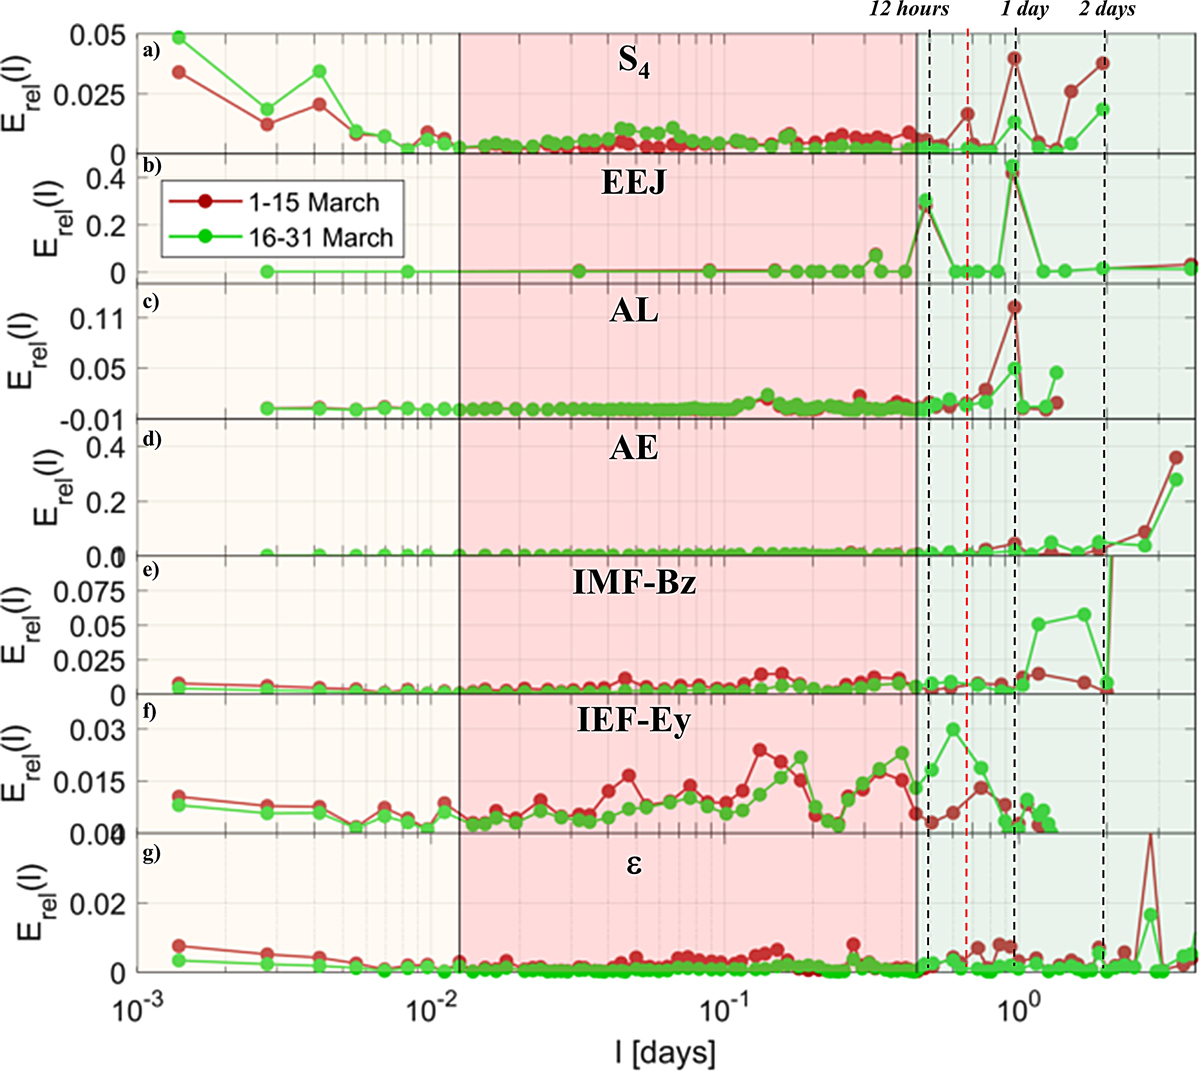
Relative energy of each intrinsic mode function as a function of the period (in days) calculated for (a) S 4, (b) Equatorial Electrojet, (c) AL index, (d) AE index, (e) IMF-Bz, (f) IEF-Ex and (g) ε parameter. Red curves are for 1–15 March 2011, while green curves for the period 16–31 March 2011. Similarly to Figure 3, shaded colors (yellow, red, green) indicate three different intervals of periods: low periods (yellow), middle periods (red) and high periods (green). Black dashed lines indicate 12 h, 1 day and 2 days, respectively, while the red-dashed line is in correspondence with 18 h.
Current usage metrics show cumulative count of Article Views (full-text article views including HTML views, PDF and ePub downloads, according to the available data) and Abstracts Views on Vision4Press platform.
Data correspond to usage on the plateform after 2015. The current usage metrics is available 48-96 hours after online publication and is updated daily on week days.
Initial download of the metrics may take a while.