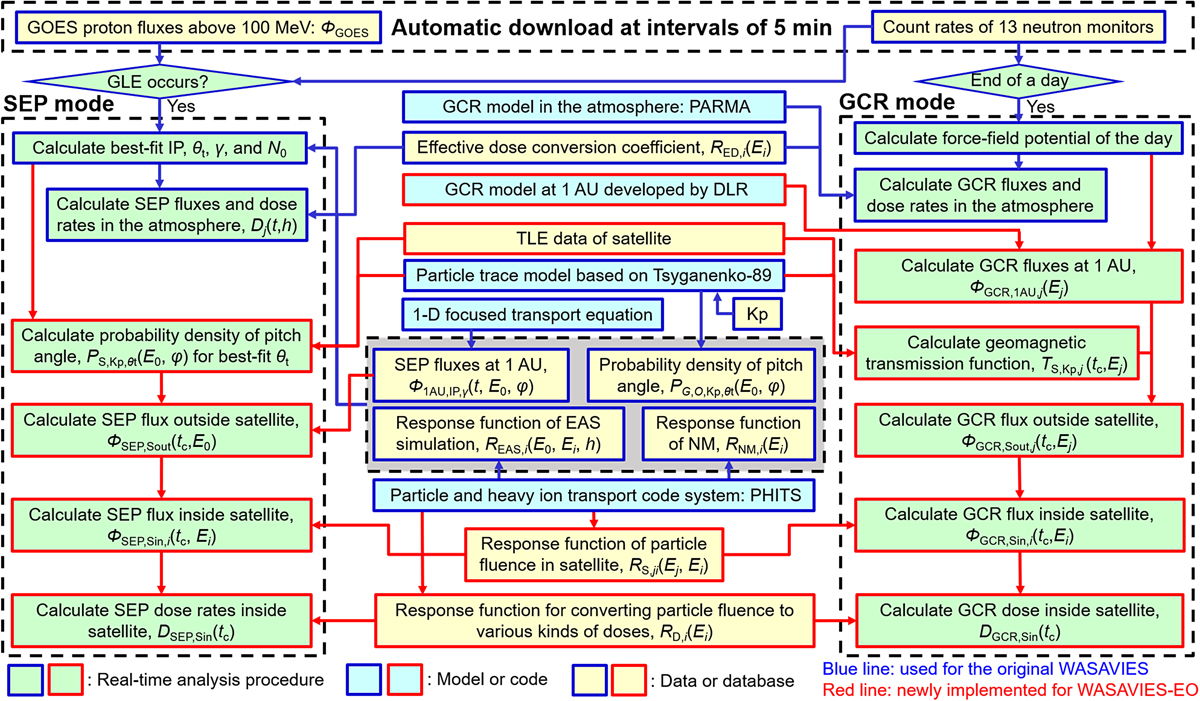
Fig. 1

Download original image
Flowchart of calculation procedures of WASAVIES-EO. The pastel green, cyan, and yellow boxes indicate the real-time analysis procedure, model or code, and data or database, respectively. The boxes in the blue frame are used in the original WASAVIES, while those with red frame are newly implemented in WASAVIES-EO. All databases included in the gray box are used for calculating the best-fit IP, θt, γ, and N0, while only the database of SEP fluxes at 1 AU is used for calculating SEP flux outside satellite. The Kp index is automatically updated at intervals of 3 h.
Current usage metrics show cumulative count of Article Views (full-text article views including HTML views, PDF and ePub downloads, according to the available data) and Abstracts Views on Vision4Press platform.
Data correspond to usage on the plateform after 2015. The current usage metrics is available 48-96 hours after online publication and is updated daily on week days.
Initial download of the metrics may take a while.


