Fig. 5
Download original image
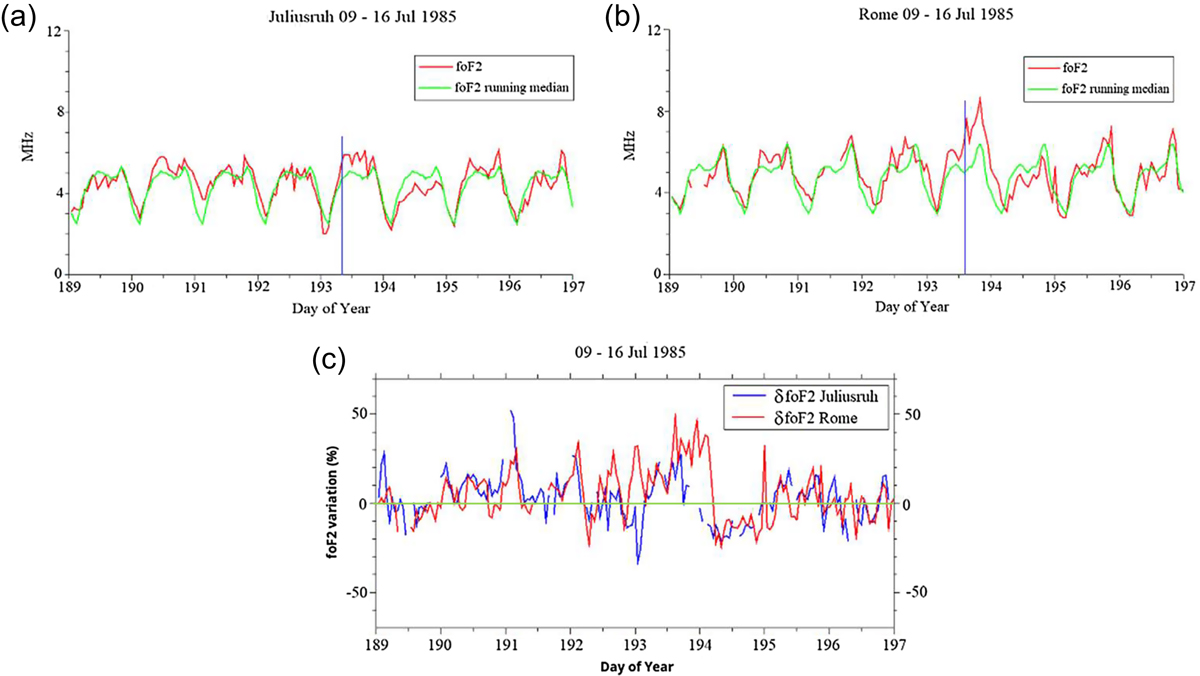
(a) Hourly values of foF2 as recorded at Juliusruh ionospheric station from 09 to 16 July 1985 (red line) together the foF2 running median evolution in the same period (green line). The latter is considered as a background value of the ionospheric parameter. (b) Hourly values of foF2 as recorded at the Ionospheric Observatory of Rome from 09 to 16 July 1985 (red line) together the foF2 running median evolution in the same period (green line). The blue vertical lines in the plots represent the onset of the strong positive phase of the ionospheric storm recorded in the two observatories. In panel (c) is reported the variation in percentage of the foF2 for the two ionospheric stations, for the considered period.
Current usage metrics show cumulative count of Article Views (full-text article views including HTML views, PDF and ePub downloads, according to the available data) and Abstracts Views on Vision4Press platform.
Data correspond to usage on the plateform after 2015. The current usage metrics is available 48-96 hours after online publication and is updated daily on week days.
Initial download of the metrics may take a while.