Fig. 8
Download original image
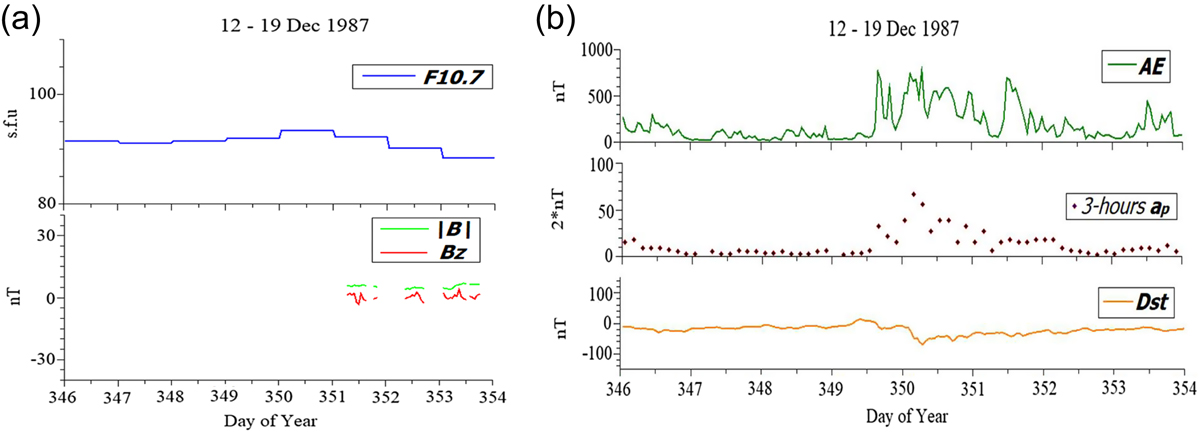
In panel (a) is described, from up to down, Solar flux F10.7 from 12 to 19 December 1987, and, for the same time period, the behaviour of the magnitude and the Z component of the IMF. Panel (b) shows, from up to down, the AE, the a p and the Dst indices, from 12 to 19 December 1987. (The hourly AE index data are retrieved through the Kyoto AE index service http://wdc.kugi.kyoto-u.ac.jp/dstae/index.html. Three-hour a p data are provided by NOAA ftp://ftp.ngdc.noaa.gov/STP/GEOMAGNETIC_DATA/INDICES/KP_AP. Dst and Solar data are obtained from NASA Goddard Space Physics Data Facilities OMNIWEB: https://omniweb.gsfc.nasa.gov/form/dx1.html).
Current usage metrics show cumulative count of Article Views (full-text article views including HTML views, PDF and ePub downloads, according to the available data) and Abstracts Views on Vision4Press platform.
Data correspond to usage on the plateform after 2015. The current usage metrics is available 48-96 hours after online publication and is updated daily on week days.
Initial download of the metrics may take a while.