Fig. 10
Download original image
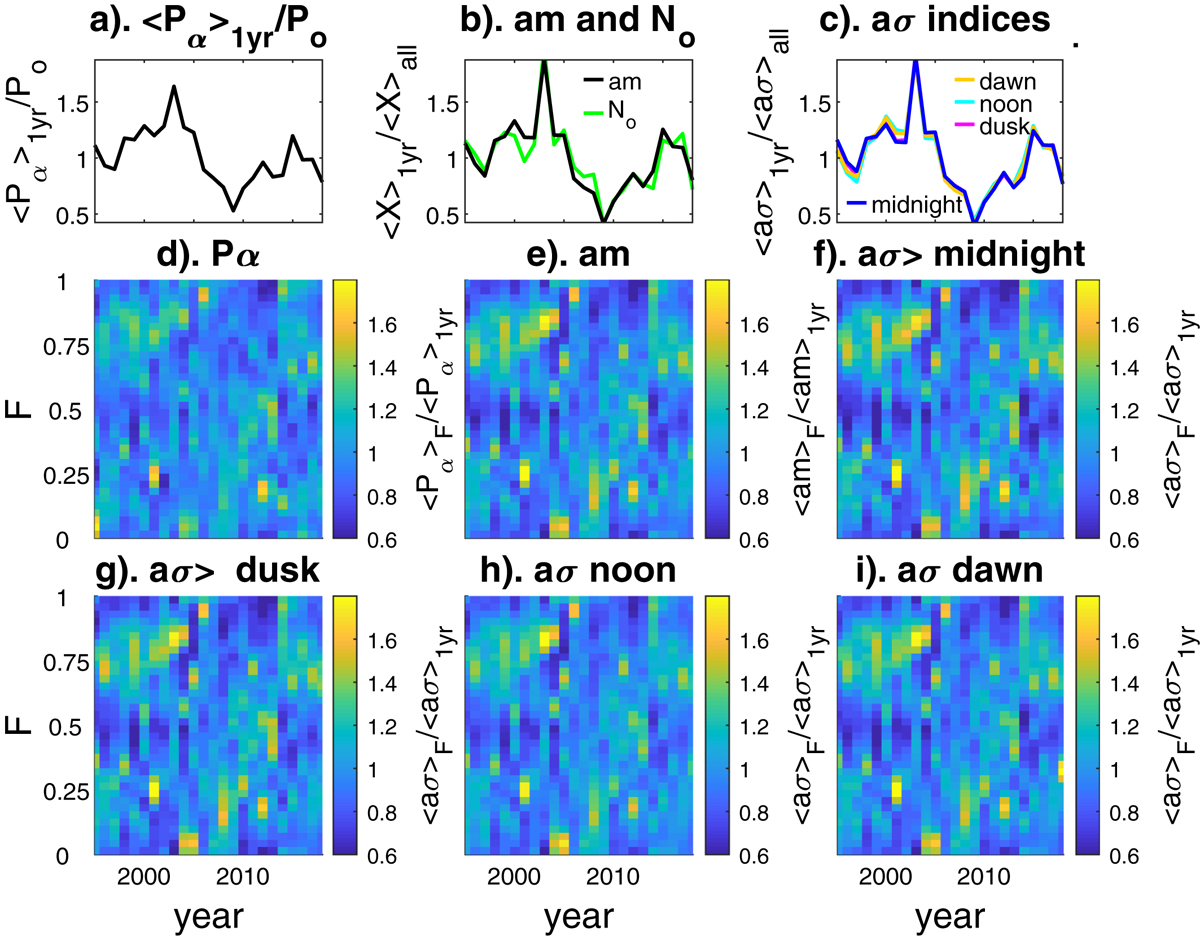
Top panel: plots of annual means of an index or variable x, <x>1yr, for the years 1995–2017, inclusive, where x is: (a) the power input into the magnetosphere, Pα; (b) the am index (in black) and the number of substorm onsets derived from the SML index, No (in green); (c) the aσ indices for dawn (orange), noon (cyan), dusk (mauve) and midnight (blue). Middle and lower panels: year-F spectrogram plots of the means in 36 equal-sized bins of F, divided by the mean for that year, <x>F/<x>1yr, where x is: (d) Pα; (e) am; (f) aσmidnight; (g) aσdawn, (h) aσnoon, and (i) aσdusk. The data have been smoothed by applying a 3-point running mean to the time series of means in the bins of width (1/36) yr.
Current usage metrics show cumulative count of Article Views (full-text article views including HTML views, PDF and ePub downloads, according to the available data) and Abstracts Views on Vision4Press platform.
Data correspond to usage on the plateform after 2015. The current usage metrics is available 48-96 hours after online publication and is updated daily on week days.
Initial download of the metrics may take a while.