Fig. 16

Download original image
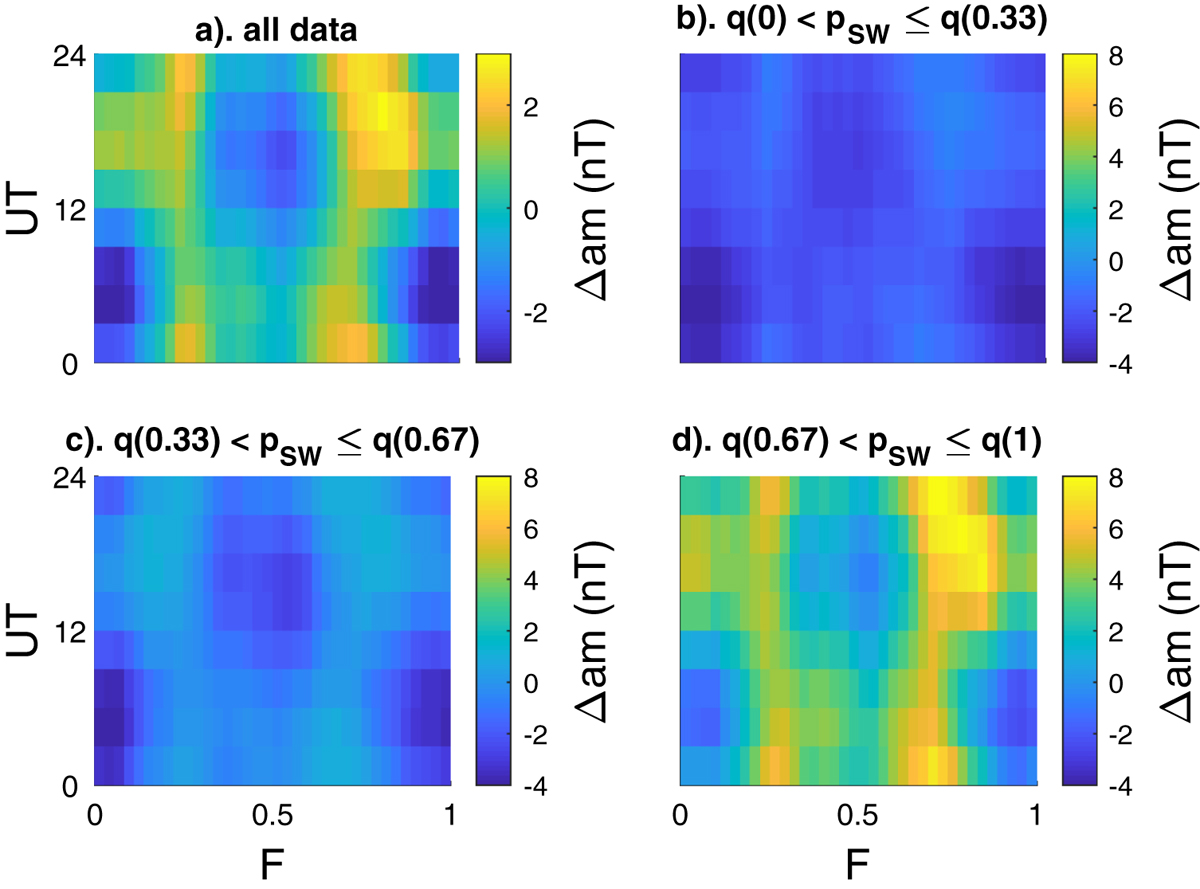
F–UT pattern plots of the fit residuals Δam in Figure 15b for 1995–2017, inclusive. In each case the plots are constructed using hourly means of the solar wind dynamic pressure pSW and the three-hourly fit residuals Δam are interpolated to the mid-point of those hourly intervals. All plots are then smoothed with a 1–3–1 triangular weighting filter in both the F and UT dimension. (a) The overall mean value of Δam. (b) The mean Δam for the lower tercile of the simultaneous solar wind dynamic pressure, <Δam>F,UT for q(0) ≤ <pSW>τ=1h < q(0.33). (c) The mean Δam for the middle tercile of the simultaneous solar wind dynamic pressure, i.e., <Δam>F,UT for q(0.33) ≤ <pSW>τ=1h < q(0.67). (d) The mean Δam for the upper tercile of the simultaneous solar wind dynamic pressure, <Δam>F,UT for q(0.67) ≤ <pSW>τ=1h < q(1). Note that in parts (b–d) the same color scale is used to emphasize that the equinoctial pattern, although present for all three ranges of pSW, is of amplitude that increases with pSW and is much larger in amplitude for the largest pSW values. This relationship is further studied by Figure 17.
Current usage metrics show cumulative count of Article Views (full-text article views including HTML views, PDF and ePub downloads, according to the available data) and Abstracts Views on Vision4Press platform.
Data correspond to usage on the plateform after 2015. The current usage metrics is available 48-96 hours after online publication and is updated daily on week days.
Initial download of the metrics may take a while.


