Fig. 18
Download original image
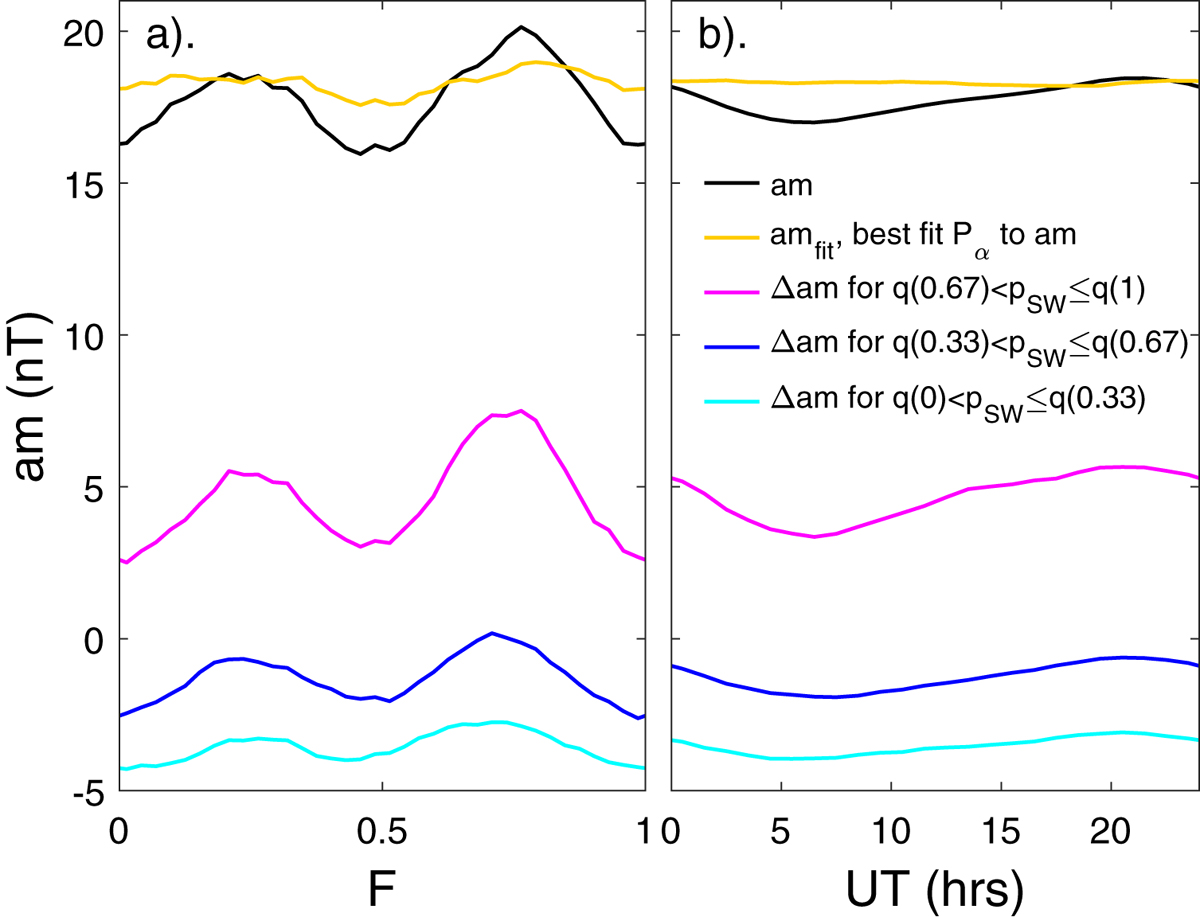
Analysis of the contributions to the (a) semi-annual and (b) UT variations of the am index observed in the interval 1995–2017, inclusive. Mean values are shown as a function of (a) time-of-year F and (b) UT of: (black lines) the observed am data; (orange lines) amfit, the best-fit of power input to the magnetosphere, Pα/Po to am; (mauve lines) the fit residual Δam for the upper tercile of the solar wind dynamic pressure, q(0.67)<pSW ≤ q(1); (blue lines) the fit residual Δam for the middle tercile of the solar wind dynamic pressure, q(0.33) < pSW ≤ q(0.67); and (cyan lines) the fit residual Δam for the lower tercile of the solar wind dynamic pressure, q(0) < pSW ≤ q(0.33).
Current usage metrics show cumulative count of Article Views (full-text article views including HTML views, PDF and ePub downloads, according to the available data) and Abstracts Views on Vision4Press platform.
Data correspond to usage on the plateform after 2015. The current usage metrics is available 48-96 hours after online publication and is updated daily on week days.
Initial download of the metrics may take a while.