Fig. 4

Download original image
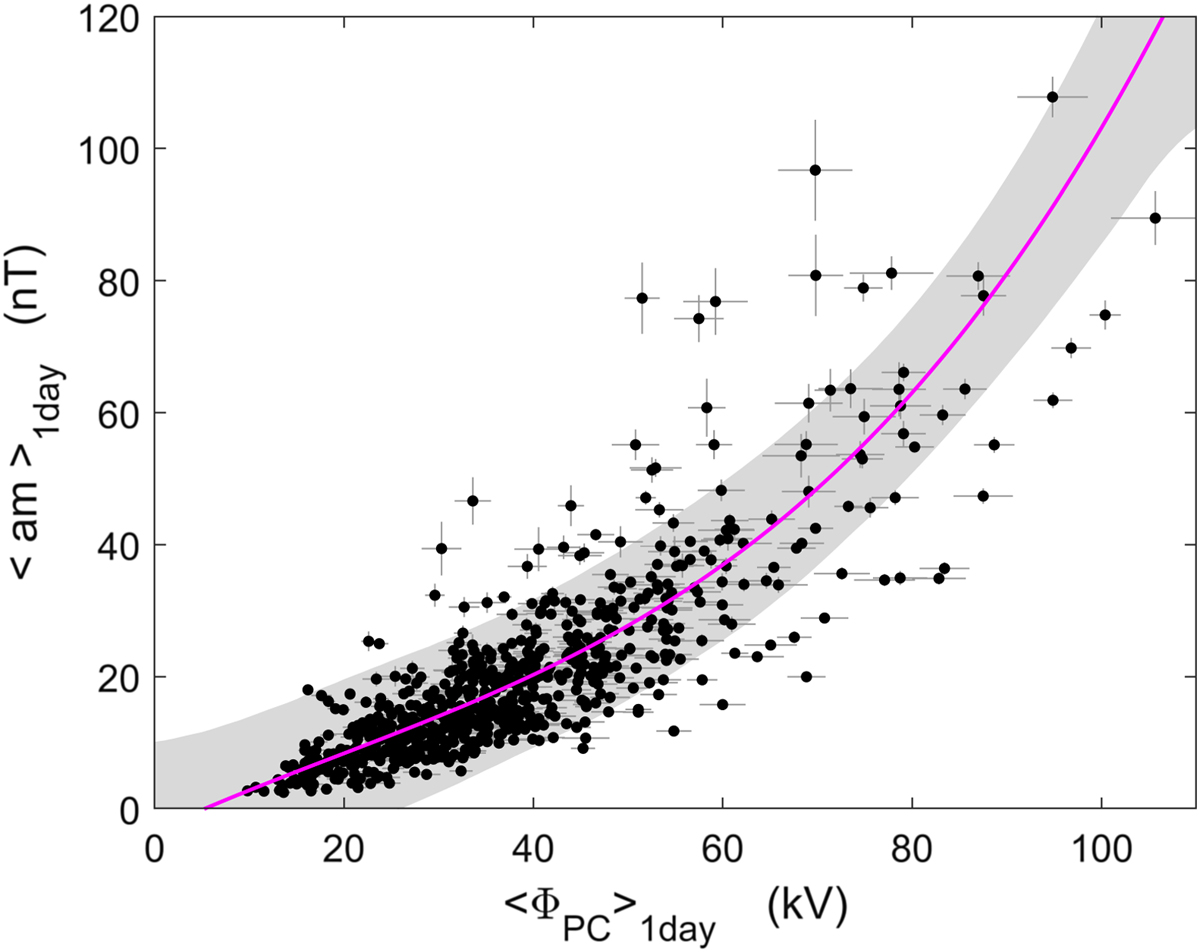
Scatter plot of daily means of the am index as a function of the corresponding daily mean transpolar voltage, ΦPC, as determined for 2001–2002 by DMSP satellites (principally F13) and normalised for the satellite track to an ideal 06–18 MLT path using the procedure of Lockwood et al. (2009). The error bars are plus and minus one standard error in the means. The mauve line is the best-fit 3rd order polynomial fit and the grey area is bounded by the 2-sigma uncertainty level in that fit. The fitting procedure is given in Appendix to this paper, along with polynomial expressions for the best fit and the uncertainty band edges. These can be used to estimate the am level associated with a given ΦPC: Appendix also gives the corresponding 3rd order polynomials that allow computation of the ΦPC value associated with a given am value.
Current usage metrics show cumulative count of Article Views (full-text article views including HTML views, PDF and ePub downloads, according to the available data) and Abstracts Views on Vision4Press platform.
Data correspond to usage on the plateform after 2015. The current usage metrics is available 48-96 hours after online publication and is updated daily on week days.
Initial download of the metrics may take a while.


