Fig. 6
Download original image
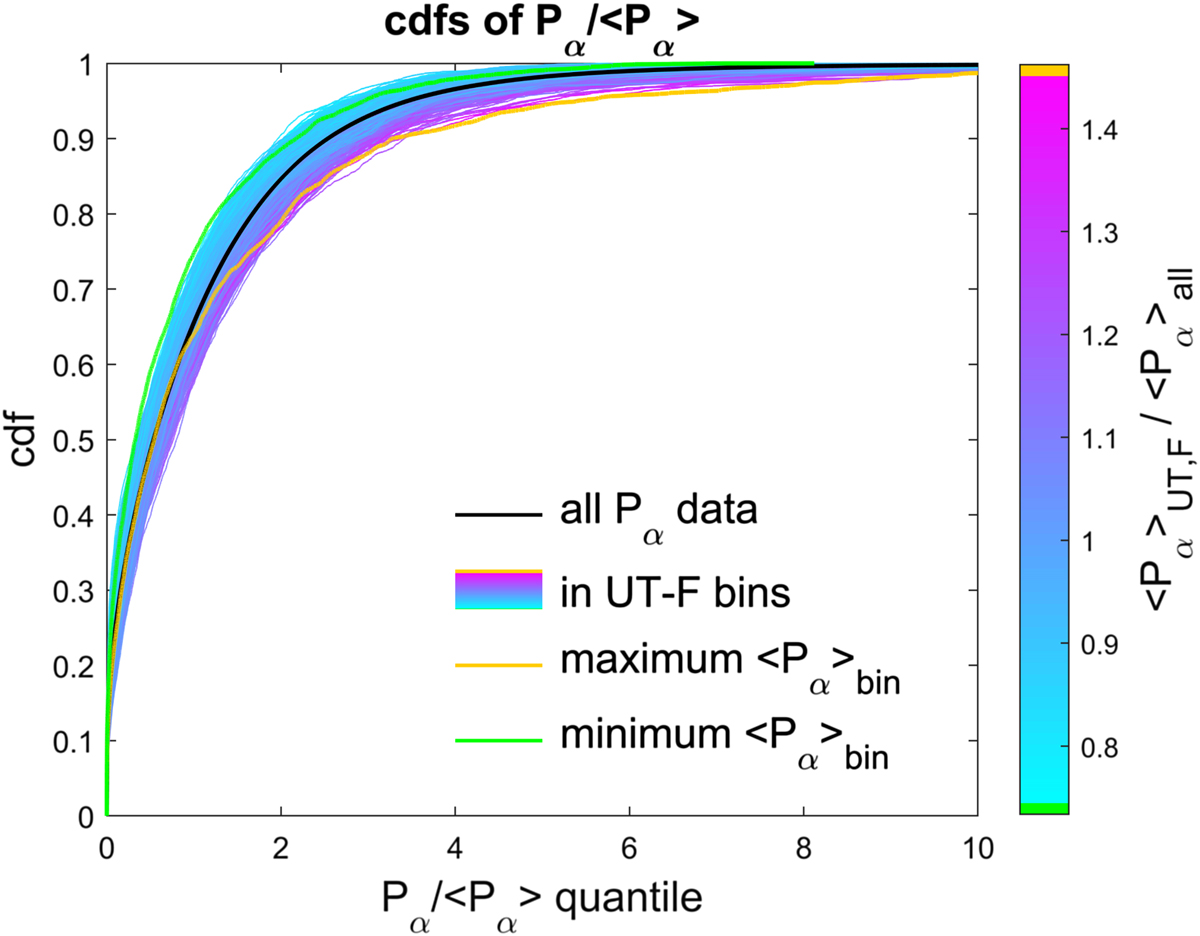
Cumulative probability distributions (c.d.f.s) of the power input to the magnetosphere, Pα, as a ratio of its mean value Po = <Pα>all for the full interval of near-continuous interplanetary data (1995–2017, inclusive). The Pα/Po data are divided into 288 bins: 36 equal-sized bins in fraction of year F and the same eight 3-h Universal Time (UT) bins over which the range am index is evaluated. For each F–UT bin the c.d.f. of Pα/Po as a ratio of the mean value for that bin <Pα/Po>F,UT was plotted and colored according to the value of that ratio. The black line is for all Pα/Po data, the orange line for the F–UT bin giving the largest <Pα/Po>F,UT and the green line for the F–UT bin giving the smallest <Pα/Po>F,UT.
Current usage metrics show cumulative count of Article Views (full-text article views including HTML views, PDF and ePub downloads, according to the available data) and Abstracts Views on Vision4Press platform.
Data correspond to usage on the plateform after 2015. The current usage metrics is available 48-96 hours after online publication and is updated daily on week days.
Initial download of the metrics may take a while.