Fig. 8
Download original image
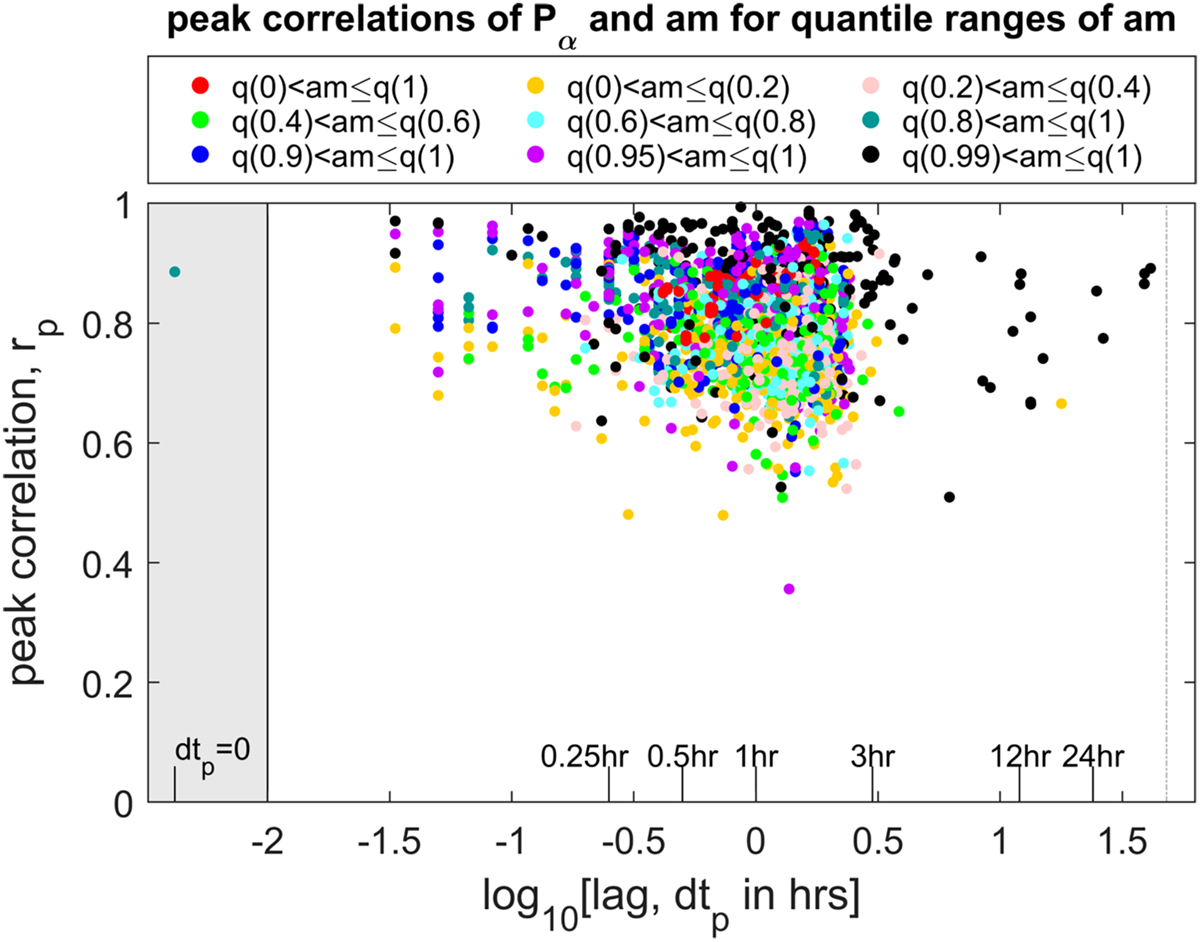
Peak correlation rp between am and 3-hourly means of Pα/Po as a function of the logarithm of the lag dtp giving that peak correlation, for data from 1995–2017, inclusive. One-minute Pα/Po data were averaged into hourly and then 3-hourly intervals, centred on the mid-points of the am data intervals, minus a response lag dt that was varied between −10 min and 5 h in steps of one minute. At each dt the correlation between Pα(t − dt)/Po and am(t) is evaluated for each of the data subsets studied. The data are divided and colour-coded into 9 quantile ranges of am given by the legend. We use the notation that 20% of all the data have am values lower than q(0.2). The red dots are for all data, q(0) < am ≤ q(1). Five of the quantile ranges each contain 20% of the data: q(0) < am ≤ q(0.2), q(0.2) < am ≤ q(0.4), q(0.4) < am ≤ q(0.6), q(0.6) < am ≤ q(0.8) and q(0.8) < am ≤ q(1). In addition, the plot studies the top 10%, 5% and 1% of all am values, respectively q(0.9) < am ≤ q(1), q(0.95) < am ≤ q(1), and q(0.99) < am ≤ q(1). Correlations are shown for F–UT–m bins that have more than 16 samples and for which the correlation significance exceeds 95%.
Current usage metrics show cumulative count of Article Views (full-text article views including HTML views, PDF and ePub downloads, according to the available data) and Abstracts Views on Vision4Press platform.
Data correspond to usage on the plateform after 2015. The current usage metrics is available 48-96 hours after online publication and is updated daily on week days.
Initial download of the metrics may take a while.