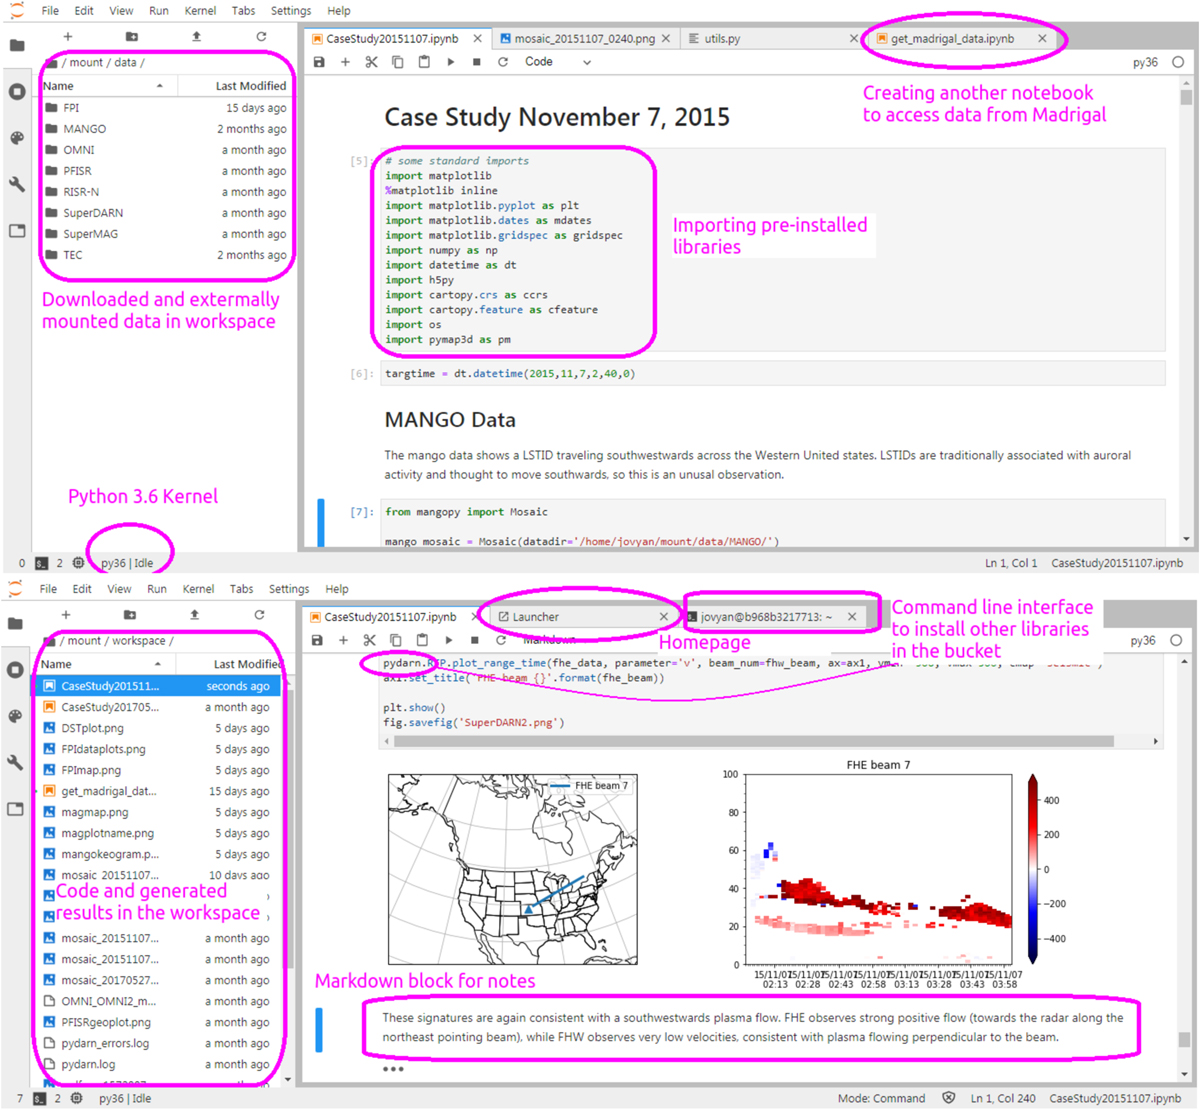
Fig. 3
Download original image
Annotated screenshots from JupyterLab interface in Resen showing different components. The top panel shows the beginning of the case study notebook with data and importing pre-installed libraries. The bottom panel shows different functionalities of JupyterLab interface, where one can install other libraries like pydarn in the Resen bucket.
Current usage metrics show cumulative count of Article Views (full-text article views including HTML views, PDF and ePub downloads, according to the available data) and Abstracts Views on Vision4Press platform.
Data correspond to usage on the plateform after 2015. The current usage metrics is available 48-96 hours after online publication and is updated daily on week days.
Initial download of the metrics may take a while.