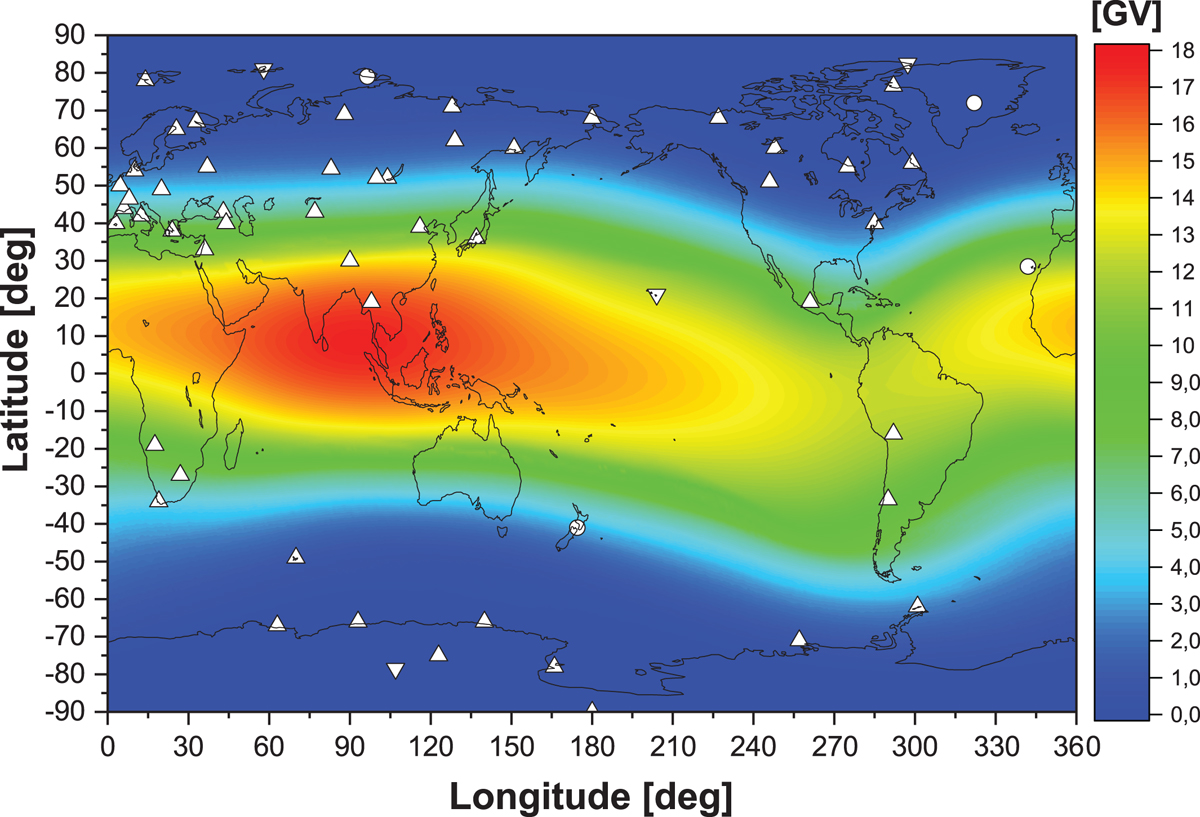
Fig. 1

Download original image
Present status of the global neutron monitor network and proposition for further extension. The up triangles correspond to presently operational stations. The down triangles correspond to previously existed stations. Circles correspond to the new stations proposed here. The color diagram depicts rigidity cut-off map computed in quiet magnetospheric conditions employing the IGRF model corresponding to epoch 2015 (Thébault et al., 2015).
Current usage metrics show cumulative count of Article Views (full-text article views including HTML views, PDF and ePub downloads, according to the available data) and Abstracts Views on Vision4Press platform.
Data correspond to usage on the plateform after 2015. The current usage metrics is available 48-96 hours after online publication and is updated daily on week days.
Initial download of the metrics may take a while.


