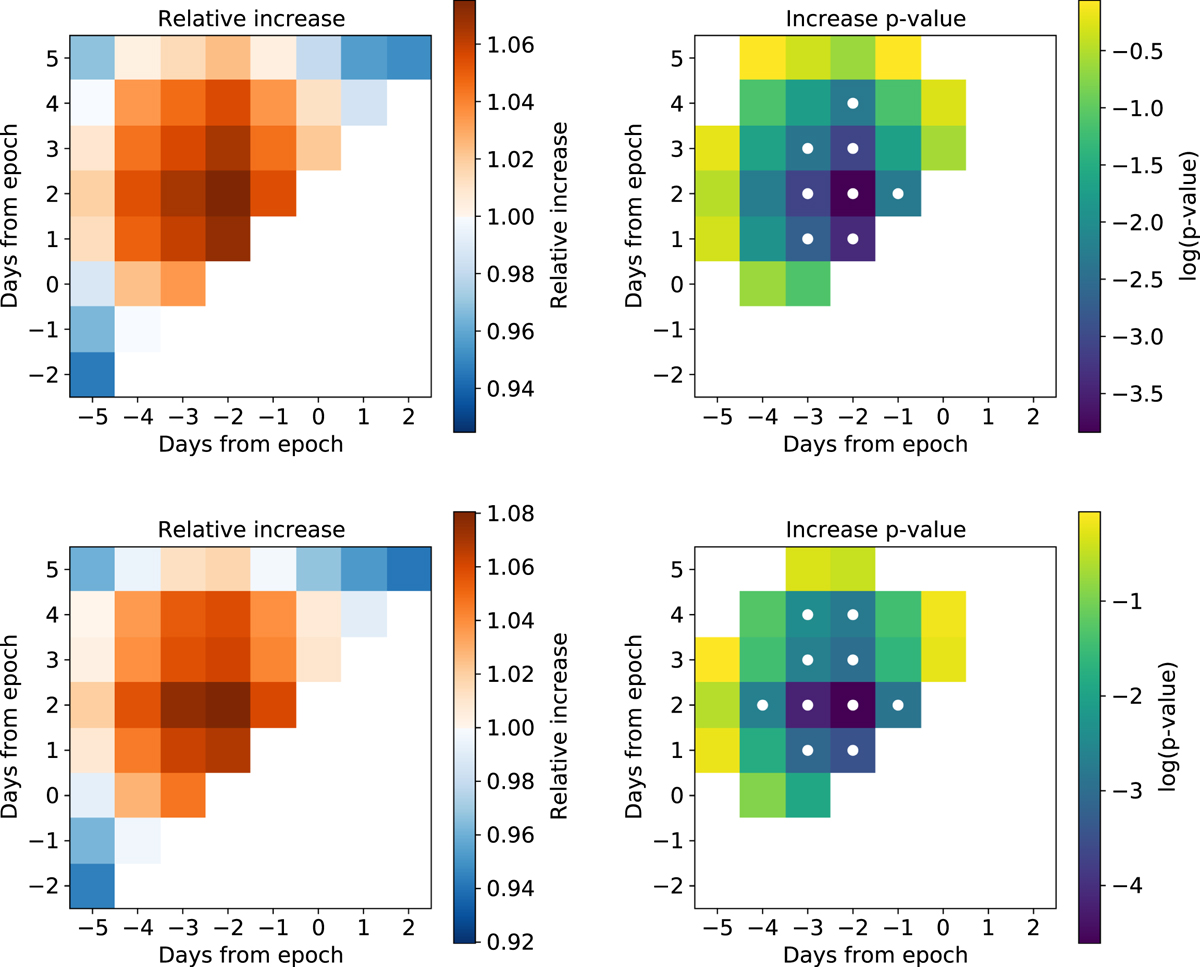
Fig. 3

Download original image
(Left) Maps for D12 of increases (or decreases) of the number of anomalies as a function of the middle day of the first (abscissa) and second (ordinate) considered 3-day periods. (Right) Maps of the corresponding p-values. The upper row is computed for the IntDst reference series, whereas the lower row corresponds to the Int(d(SYM-H)/dt) reference series. The p-values are evaluated only if there is an increase of anomaly rates in the second 3-day period as compared to the first 3-day period. Note the logarithmic scale of the plotted p-values: p = 0.0055 (the adopted level of statistical significance for individual bins) corresponds to log p = −2.26. Statistically significant bins are indicated by white dots. Blank bins are indicated by the white colour.
Current usage metrics show cumulative count of Article Views (full-text article views including HTML views, PDF and ePub downloads, according to the available data) and Abstracts Views on Vision4Press platform.
Data correspond to usage on the plateform after 2015. The current usage metrics is available 48-96 hours after online publication and is updated daily on week days.
Initial download of the metrics may take a while.


