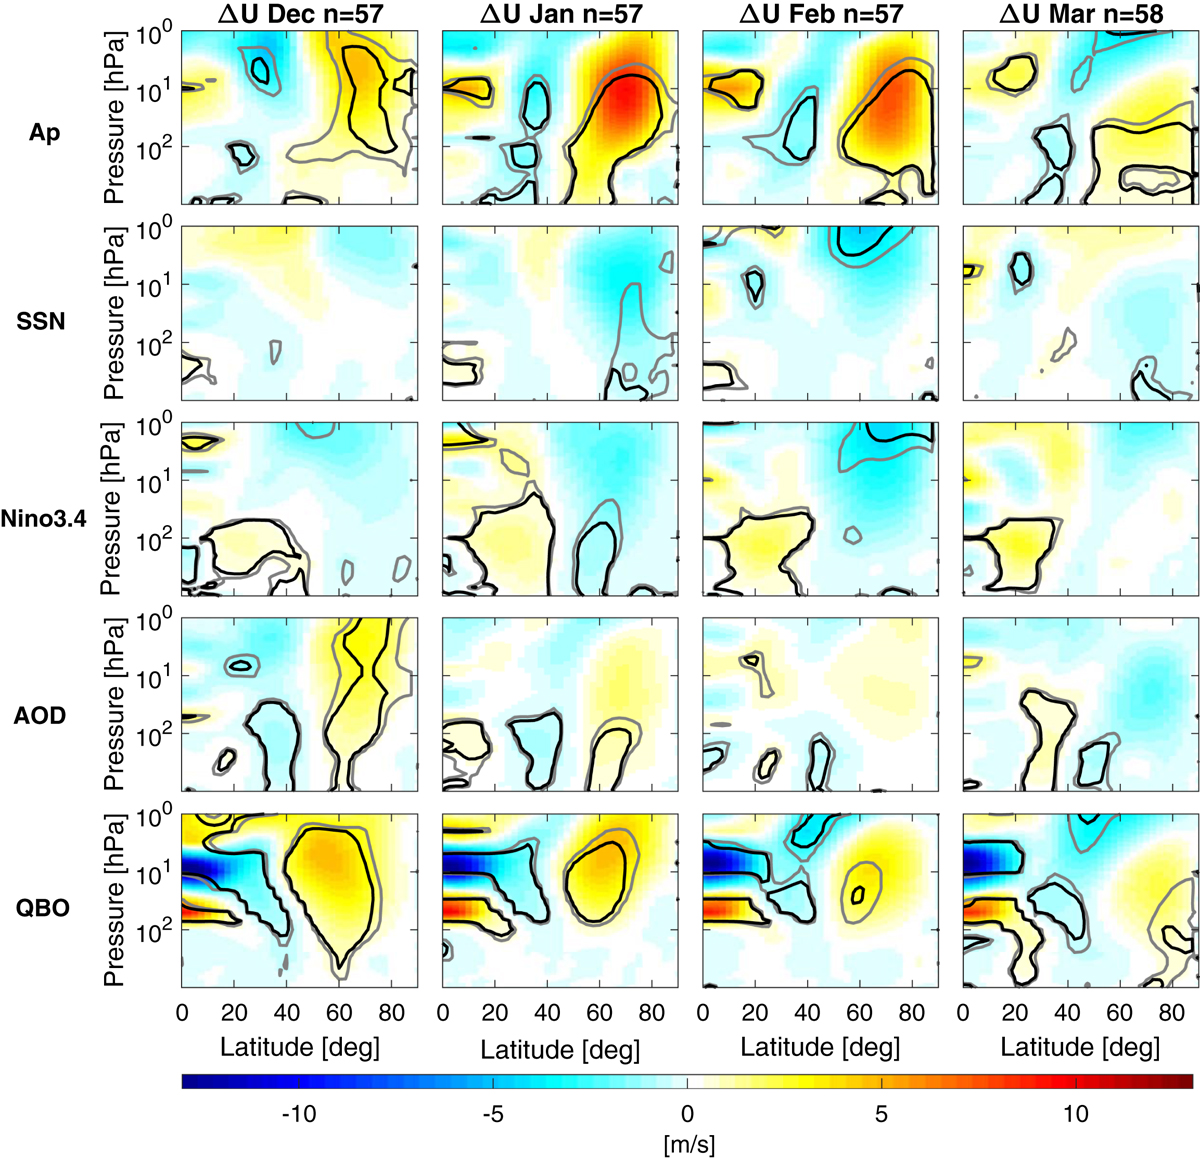
Fig. 2

Download original image
Zonally averaged zonal wind (U) responses to Ap-index (first row), sunspot number (SSN, second row), Nino 3.4 (third row), aerosol optical depth (AOD, fourth row) and Quasi–Biennial Oscillation (QBO, fifth row) in December–March (columns 1–4). Responses are obtained using MLR with Ap, SSN, Nino3.4, AOD and QBO as explanatory variables. Yellow and red correspond to positive responses, blue to negative. Black contours correspond to the 95% significance level and grey contours to the 90% level.
Current usage metrics show cumulative count of Article Views (full-text article views including HTML views, PDF and ePub downloads, according to the available data) and Abstracts Views on Vision4Press platform.
Data correspond to usage on the plateform after 2015. The current usage metrics is available 48-96 hours after online publication and is updated daily on week days.
Initial download of the metrics may take a while.


