Fig. 4
Download original image
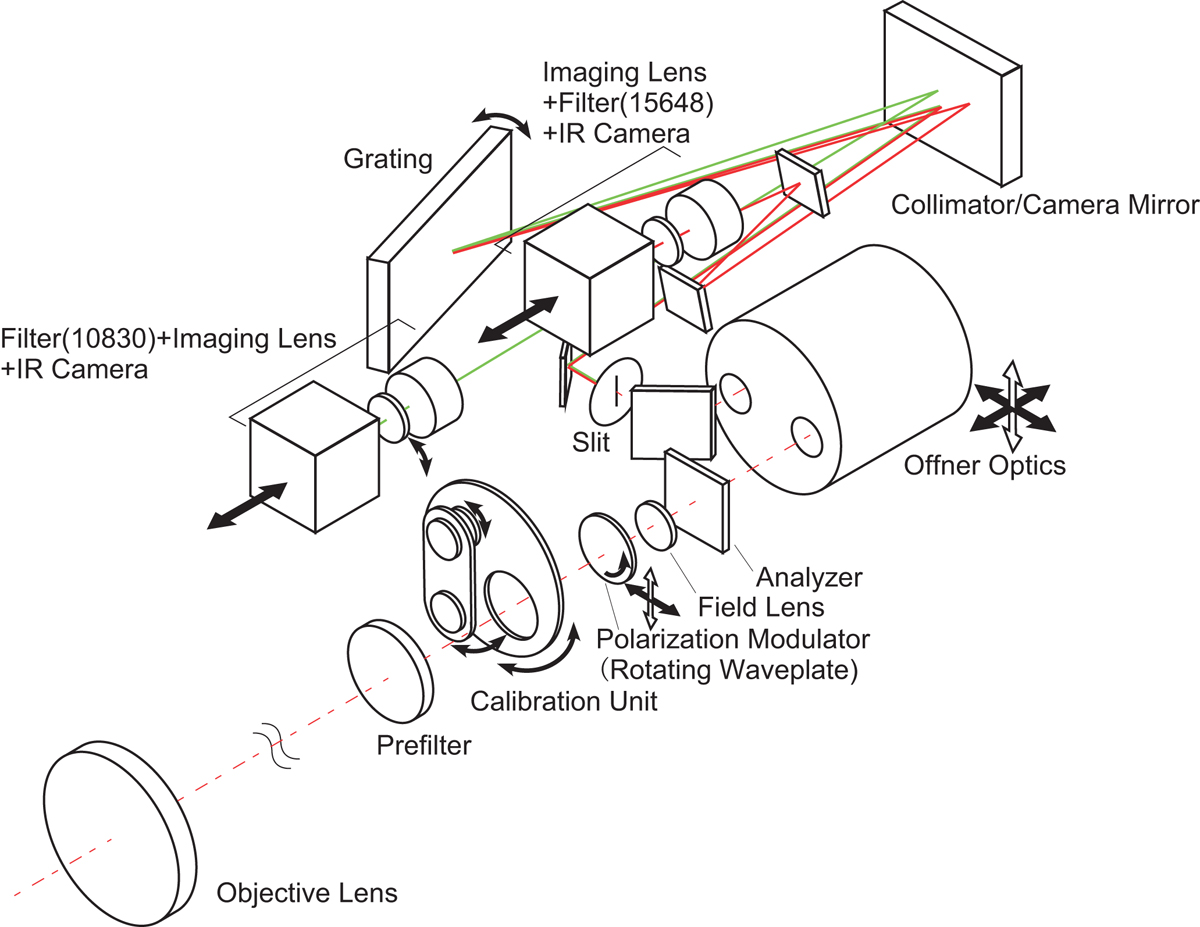
Schematic diagram of the infrared spectropolarimeter at the rear of T2 (and T3). Red dash-dot lines show the optical axis before the spectrograph slit, while green and red solid lines represent the optical axes of the 1083.0 nm and the 1564.8 nm light in the spectrograph, respectively. The arrows indicate the motion of movable parts.
Current usage metrics show cumulative count of Article Views (full-text article views including HTML views, PDF and ePub downloads, according to the available data) and Abstracts Views on Vision4Press platform.
Data correspond to usage on the plateform after 2015. The current usage metrics is available 48-96 hours after online publication and is updated daily on week days.
Initial download of the metrics may take a while.