Fig. 6
Download original image
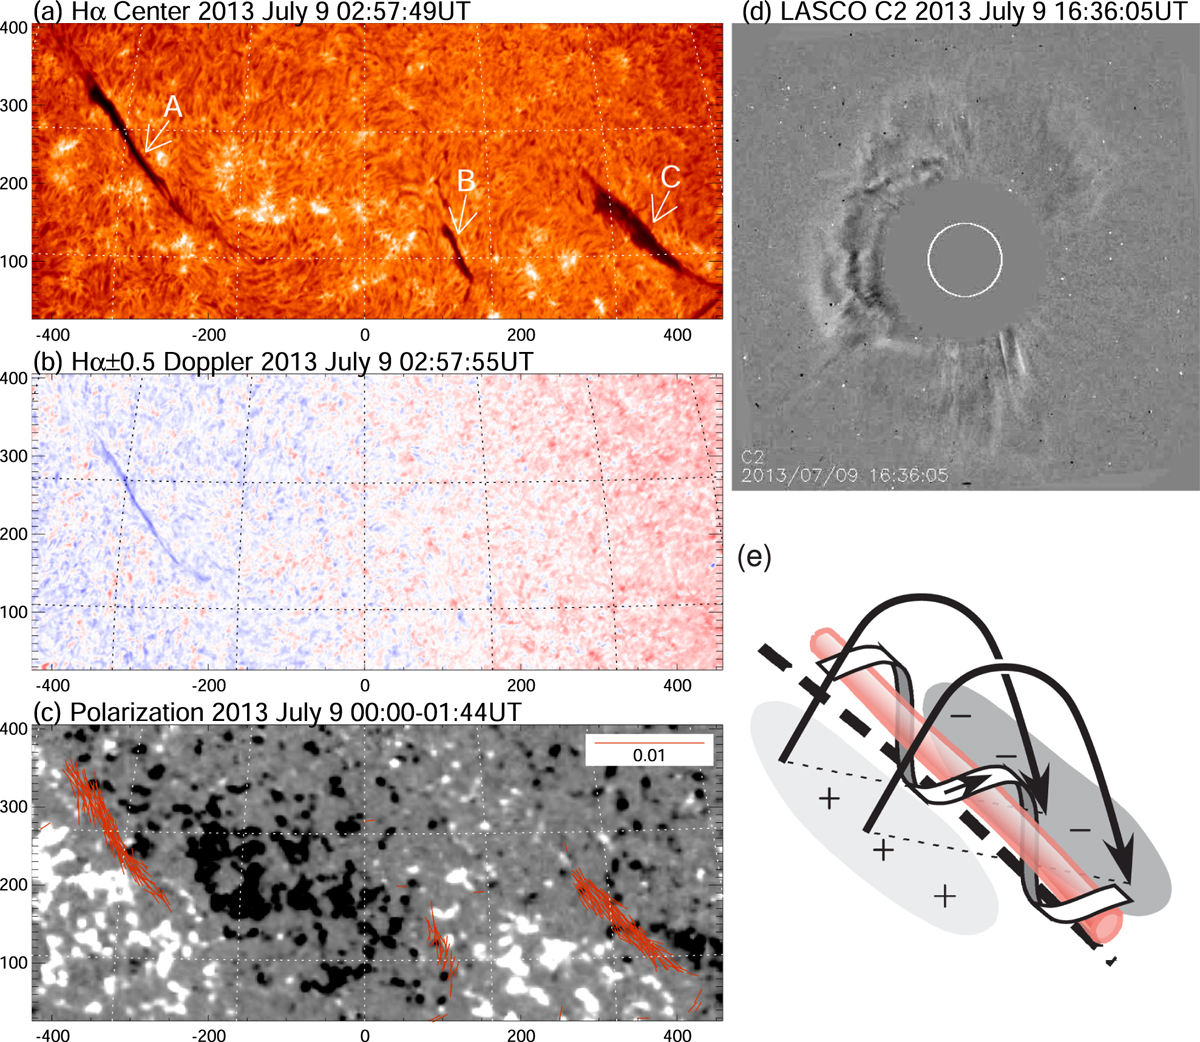
Filament observed before its eruption and CME occurring on July 9, 2013. (a) and (b) The filament before its eruption observed with the SFT. Panel (a) shows a Hα line center image, and (b) shows a Dopplergam based on the Hα ± 0.05 nm images. Blue and red shifts of the Hα line are shown in corresponding colors. Three filaments are seen in panel (a), where the one on the left labelled “A” erupted later. (c) A polarization map including the filament before eruption taken with the SFT. Red lines show the linear polarization signals of He I 1083.0 nm; the length of each line indicates the degree of the corresponding linear polarization signal (the line in the inset corresponds to the polarization of 0.01 [1%]), and its direction indicates the orientation of the polarization signal. Only the linear polarization signals > 0.1% are shown. The background gray-scape map shows the circular polarization of Si I 1082.7 nm; the display range is ± 1%. (d) A halo CME seen after the filament eruption observed using the LASCO C2 of SOHO, of which the field of view covers up to 6 solar radii. (h) Schematic representation of the magnetic field structure around the erupted filament. The red bar represents the filament material, and helical magnetic field of the flux rope surrounds it. Coronal magnetic loops connect large scale positive and negative polarities on the photosphere.
Current usage metrics show cumulative count of Article Views (full-text article views including HTML views, PDF and ePub downloads, according to the available data) and Abstracts Views on Vision4Press platform.
Data correspond to usage on the plateform after 2015. The current usage metrics is available 48-96 hours after online publication and is updated daily on week days.
Initial download of the metrics may take a while.