Fig. 11
Download original image
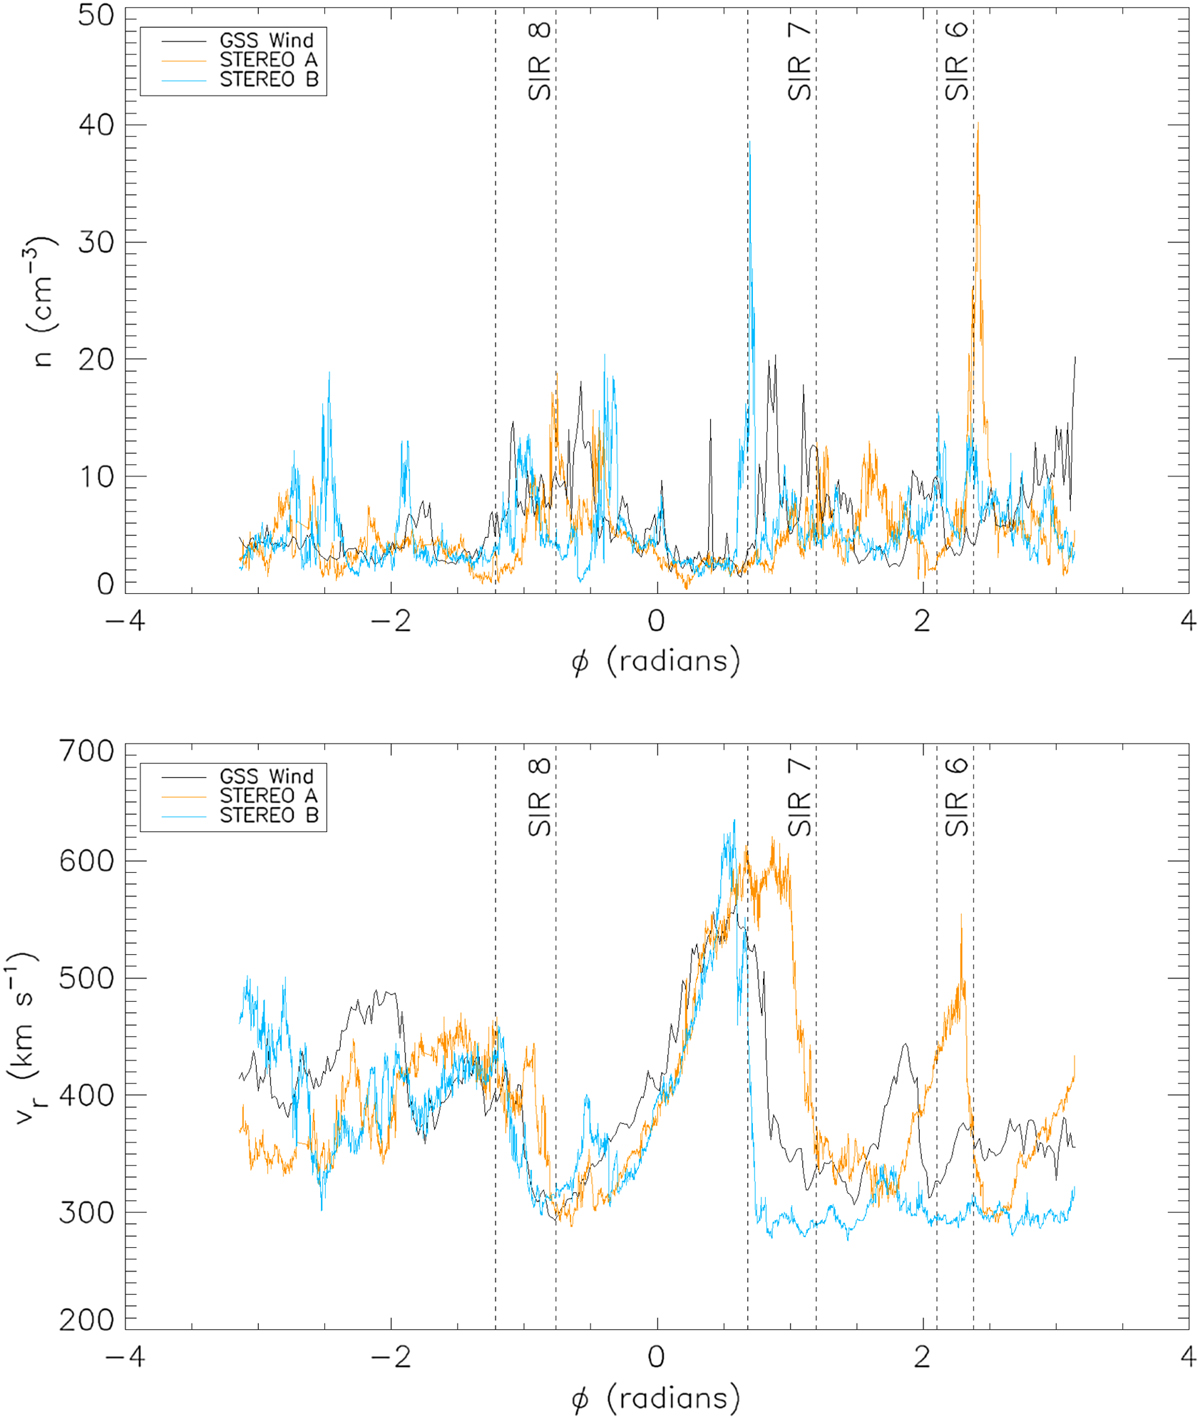
March 2009: comparison between the azimuthal profiles of number density (top) and radial speed (bottom) as measured by the twin STEREO probes (in orange STEREO-A, in blue STEREO-B) and by GGS Wind (black line). This figure shows also the longitudinal locations of SIRs/CIRs (vertical dashed lines) as derived with STEREO data (Jian et al., 2019). Time runs from right to left.
Current usage metrics show cumulative count of Article Views (full-text article views including HTML views, PDF and ePub downloads, according to the available data) and Abstracts Views on Vision4Press platform.
Data correspond to usage on the plateform after 2015. The current usage metrics is available 48-96 hours after online publication and is updated daily on week days.
Initial download of the metrics may take a while.